| Player | Player Sort | Pos | Salary | Salary Sort | Pct | Pct Sort | WARP | WARP Sort | WARP/$M | WARP/$M Sort | $/WARP | $/WARP Sort | Current Status |
|---|
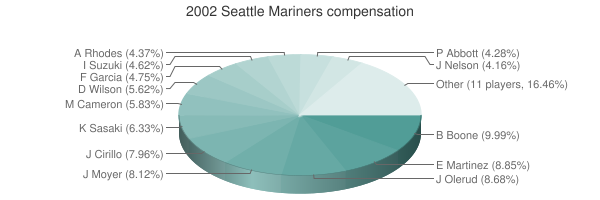
 Bret Boone
 |
Boone Bret |
2B |
$8,000,000 |
8000000 |
9.99% |
9.99 |
2.56 |
2.56294 |
0.32 |
0.3203675 |
$3,121,415 |
3121415.2496742 |
|
 Edgar Martinez
 |
Martinez Edgar |
DH |
$7,086,668 |
7086668 |
8.85% |
8.85 |
3.05 |
3.04518 |
0.43 |
0.42970546948157 |
$2,327,175 |
2327175.4050664 |
|
 John Olerud
 |
Olerud John |
1B |
$6,950,000 |
6950000 |
8.68% |
8.68 |
4.88 |
4.87872 |
0.70 |
0.70197410071942 |
$1,424,554 |
1424553.9813722 |
|
 Jamie Moyer
 |
Moyer Jamie |
RP |
$6,500,000 |
6500000 |
8.12% |
8.12 |
5.52 |
5.5166 |
0.85 |
0.84870769230769 |
$1,178,262 |
1178261.9729544 |
|
 Jeff Cirillo
 |
Cirillo Jeff |
3B |
$6,375,000 |
6375000 |
7.96% |
7.96 |
0.17 |
0.167096 |
0.03 |
0.026211137254902 |
$38,151,721 |
38151721.166276 |
|
 Kazuhiro Sasaki
 |
Sasaki Kazuhiro |
RP |
$5,070,000 |
5070000 |
6.33% |
6.33 |
2.01 |
2.00841 |
0.40 |
0.39613609467456 |
$2,524,385 |
2524384.961238 |
|
 Mike Cameron
 |
Cameron Mike |
CF |
$4,666,667 |
4666667 |
5.83% |
5.83 |
3.40 |
3.40279 |
0.73 |
0.72916923363077 |
$1,371,424 |
1371423.7434576 |
|
 Dan Wilson
 |
Wilson Dan |
C |
$4,500,000 |
4500000 |
5.62% |
5.62 |
1.56 |
1.55915 |
0.35 |
0.34647777777778 |
$2,886,188 |
2886187.9870442 |
|
 Freddy Garcia
 |
Garcia Freddy |
RP |
$3,800,000 |
3800000 |
4.75% |
4.75 |
5.90 |
5.89588 |
1.55 |
1.5515473684211 |
$644,518 |
644517.86671371 |
|
 Ichiro Suzuki
 |
Suzuki Ichiro |
RF |
$3,696,000 |
3696000 |
4.62% |
4.62 |
5.13 |
5.1295 |
1.39 |
1.3878517316017 |
$720,538 |
720538.0641388 |
|
 Arthur Rhodes
 |
Rhodes Arthur |
RP |
$3,500,000 |
3500000 |
4.37% |
4.37 |
2.39 |
2.39447 |
0.68 |
0.68413428571429 |
$1,461,701 |
1461701.3368303 |
|
 Paul Abbott
 |
Abbott Paul |
RP |
$3,425,000 |
3425000 |
4.28% |
4.28 |
-0.20 |
-0.199764 |
— |
0 |
— |
0 |
|
 Jeff Nelson
 |
Nelson Jeff |
RP |
$3,333,333 |
3333333 |
4.16% |
4.16 |
1.19 |
1.19272 |
0.36 |
0.3578160357816 |
$2,794,732 |
2794732.208733 |
|
 Mark McLemore
 |
McLemore Mark |
LF |
$3,150,000 |
3150000 |
3.93% |
3.93 |
2.07 |
2.06836 |
0.66 |
0.65662222222222 |
$1,522,946 |
1522945.7154461 |
|
 Ruben Sierra
 |
Sierra Ruben |
LF |
$1,900,000 |
1900000 |
2.37% |
2.37 |
-0.35 |
-0.352338 |
— |
0 |
— |
0 |
|
 Shigetoshi Hasegawa
 |
Hasegawa Shigetoshi |
RP |
$1,500,000 |
1500000 |
1.87% |
1.87 |
0.18 |
0.180176 |
0.12 |
0.12011733333333 |
$8,325,193 |
8325193.144481 |
|
 John Halama
 |
Halama John |
RP |
$1,400,000 |
1400000 |
1.75% |
1.75 |
1.94 |
1.94189 |
1.39 |
1.3870642857143 |
$720,947 |
720947.11852886 |
|
 Carlos Guillen
 |
Guillen Carlos |
SS |
$1,400,000 |
1400000 |
1.75% |
1.75 |
1.42 |
1.41523 |
1.01 |
1.0108785714286 |
$989,238 |
989238.49833596 |
|
 Desi Relaford
 |
Relaford Desi |
SS |
$1,275,000 |
1275000 |
1.59% |
1.59 |
1.21 |
1.20584 |
0.95 |
0.9457568627451 |
$1,057,354 |
1057354.2095137 |
|
 James Baldwin
 |
Baldwin James |
RP |
$1,250,000 |
1250000 |
1.56% |
1.56 |
-0.39 |
-0.393186 |
— |
0 |
— |
0 |
|
 Charles Gipson
 |
Gipson Charles |
LF |
$450,000 |
450000 |
0.56% |
0.56 |
0.14 |
0.143714 |
0.32 |
0.31936444444444 |
$3,131,219 |
3131218.9487454 |
|
 Ben Davis
 |
Davis Ben |
C |
$350,000 |
350000 |
0.44% |
0.44 |
1.38 |
1.37814 |
3.94 |
3.9375428571429 |
$253,965 |
253965.48971803 |
|
 Joel Pineiro
 |
Pineiro Joel |
RP |
$255,000 |
255000 |
0.32% |
0.32 |
4.40 |
4.40029 |
17.26 |
17.256039215686 |
$57,951 |
57950.725974879 |
|
 Ryan Franklin
 |
Franklin Ryan |
RP |
$250,000 |
250000 |
0.31% |
0.31 |
0.99 |
0.993884 |
3.98 |
3.975536 |
$251,538 |
251538.40890889 |
|
| Year | Mariners payroll |
PR Sort |
Avg payroll |
AvgPR Sort |
Diff |
Diff Sort |
|---|
| 1990 | $150,000 | 150000 | $1,203,571 | 1203571 | $-1,053,571 | -1053571 |
| 1991 | $350,000 | 350000 | $1,884,642 | 1884642 | $-1,534,642 | -1534642 |
| 1992 | $1,392,500 | 1392500 | $2,356,071 | 2356071 | $-963,571 | -963571 |
| 1993 | $2,625,000 | 2625000 | $3,410,000 | 3410000 | $-785,000 | -785000 |
| 1994 | $3,275,000 | 3275000 | $3,447,916 | 3447916 | $-172,916 | -172916 |
| 1995 | $4,425,000 | 4425000 | $4,591,041 | 4591041 | $-166,041 | -166041 |
| 1996 | $6,025,000 | 6025000 | $4,109,148 | 4109148 | $1,915,852 | 1915852 |
| 1997 | $6,275,000 | 6275000 | $4,753,000 | 4753000 | $1,522,000 | 1522000 |
| 1998 | $6,000,000 | 6000000 | $6,661,904 | 6661904 | $-661,904 | -661904 |
| 2000 | $58,760,000 | 58760000 | $55,368,142 | 55368142 | $3,391,858 | 3391858 |
| 2001 | $74,518,334 | 74518334 | $64,937,084 | 64937084 | $9,581,250 | 9581250 |
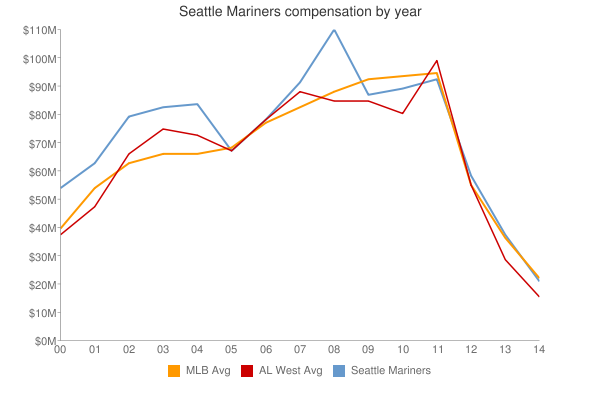
| 2002 | $80,082,668 | 80082668 | $67,238,672 | 67238672 | $12,843,996 | 12843996 |
| 2003 | $85,599,167 | 85599167 | $70,654,480 | 70654480 | $14,944,687 | 14944687 |
| 2004 | $80,299,167 | 80299167 | $69,466,729 | 69466729 | $10,832,438 | 10832438 |
| 2005 | $90,162,667 | 90162667 | $74,114,841 | 74114841 | $16,047,826 | 16047826 |
| 2006 | $87,353,500 | 87353500 | $79,621,815 | 79621815 | $7,731,685 | 7731685 |
| 2007 | $104,555,000 | 104555000 | $85,537,470 | 85537470 | $19,017,530 | 19017530 |
| 2008 | $119,080,500 | 119080500 | $92,003,799 | 92003799 | $27,076,701 | 27076701 |
| 2009 | $99,582,500 | 99582500 | $92,169,598 | 92169598 | $7,412,902 | 7412902 |
| 2010 | $89,443,333 | 89443333 | $94,342,601 | 94342601 | $-4,899,268 | -4899268 |
| 2011 | $96,323,191 | 96323191 | $96,974,710 | 96974710 | $-651,519 | -651519 |
| 2012 | $84,778,100 | 84778100 | $100,947,217 | 100947217 | $-16,169,117 | -16169117 |
| 2013 | $84,705,043 | 84705043 | $108,586,966 | 108586966 | $-23,881,923 | -23881923 |
| 2014 | $90,239,643 | 90239643 | $117,131,361 | 117131361 | $-26,891,718 | -26891718 |
| 2015 | $123,225,843 | 123225843 | $126,168,161 | 126168161 | $-2,942,318 | -2942318 |
| 2016 | $142,330,193 | 142330193 | $131,756,569 | 131756569 | $10,573,624 | 10573624 |
| 2017 | $154,318,843 | 154318843 | $136,337,445 | 136337445 | $17,981,398 | 17981398 |
| 2018 | $157,903,943 | 157903943 | $135,360,600 | 135360600 | $22,543,343 | 22543343 |
| 2019 | $146,498,473 | 146498473 | $134,792,134 | 134792134 | $11,706,339 | 11706339 |
| 2020 | $101,257,961 | 101257961 | $139,496,467 | 139496467 | $-38,238,506 | -38238506 |
| 2021 | $81,000,900 | 81000900 | $130,712,288 | 130712288 | $-49,711,388 | -49711388 |
| 2022 | $103,901,114 | 103901114 | $149,802,695 | 149802695 | $-45,901,581 | -45901581 |
| 2023 | $126,555,662 | 126555662 | $161,692,345 | 161692345 | $-35,136,683 | -35136683 |
| 2024 | $56,006,547 | 56006547 | $136,306,249 | 136306249 | $-80,299,702 | -80299702 |
| 2025 | $80,281,547 | 80281547 | $98,329,527 | 98329527 | $-18,047,980 | -18047980 |
| 2026 | $33,185,714 | 33185714 | $78,039,273 | 78039273 | $-44,853,559 | -44853559 |
| 2027 | $20,185,714 | 20185714 | $60,919,343 | 60919343 | $-40,733,629 | -40733629 |
| 2028 | $20,185,714 | 20185714 | $46,901,712 | 46901712 | $-26,715,998 | -26715998 |
| 2029 | $20,185,714 | 20185714 | $38,597,944 | 38597944 | $-18,412,230 | -18412230 |
| 2030 | $18,000,000 | 18000000 | $41,447,579 | 41447579 | $-23,447,579 | -23447579 |
| 2031 | $18,000,000 | 18000000 | $38,360,152 | 38360152 | $-20,360,152 | -20360152 |
| 2032 | $18,000,000 | 18000000 | $47,925,459 | 47925459 | $-29,925,459 | -29925459 |
| 2033 | $18,000,000 | 18000000 | $43,068,924 | 43068924 | $-25,068,924 | -25068924 |
| 2034 | $18,000,000 | 18000000 | $29,428,571 | 29428571 | $-11,428,571 | -11428571 |
|
 2002 Seattle Mariners


