| Player | Player Sort | Pos | Salary | Salary Sort | Pct | Pct Sort | WARP | WARP Sort | WARP/$M | WARP/$M Sort | $/WARP | $/WARP Sort | Current Status |
|---|
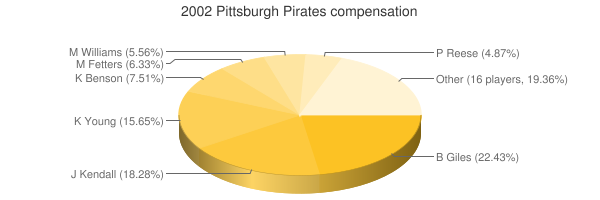
 Brian Giles
 |
Giles Brian |
LF |
$8,063,003 |
8063003 |
19.24% |
19.24 |
7.76 |
7.75967 |
0.96 |
0.96237964936885 |
$1,039,091 |
1039090.9664973 |
|
 Jason Kendall
 |
Kendall Jason |
C |
$6,571,429 |
6571429 |
15.68% |
15.68 |
2.29 |
2.29354 |
0.35 |
0.34901693375977 |
$2,865,190 |
2865190.4915545 |
|
 Kevin Young
 |
Young Kevin |
1B |
$5,625,000 |
5625000 |
13.42% |
13.42 |
1.08 |
1.08286 |
0.19 |
0.19250844444444 |
$5,194,577 |
5194577.323015 |
|
 Pat Meares
 |
Meares Pat |
DNP |
$3,790,000 |
3790000 |
9.04% |
9.04 |
— |
0.00 |
— |
0 |
— |
0 |
|
 Kris Benson
 |
Benson Kris |
RP |
$2,700,000 |
2700000 |
6.44% |
6.44 |
-0.82 |
-0.817908 |
— |
0 |
— |
0 |
|
 Mike Fetters
 |
Fetters Mike |
RP |
$2,275,000 |
2275000 |
5.43% |
5.43 |
0.43 |
0.427559 |
0.19 |
0.18793802197802 |
$5,320,903 |
5320903.0800428 |
|
 Mike Williams
 |
Williams Mike |
RP |
$2,000,000 |
2000000 |
4.77% |
4.77 |
0.61 |
0.614977 |
0.31 |
0.3074885 |
$3,252,154 |
3252154.1456022 |
|
 Pokey Reese
 |
Reese Pokey |
2B |
$1,750,000 |
1750000 |
4.18% |
4.18 |
1.41 |
1.41127 |
0.81 |
0.80644 |
$1,240,018 |
1240017.8562571 |
|
 Sean Lowe
 |
Lowe Sean |
RP |
$950,000 |
950000 |
2.27% |
2.27 |
0.50 |
0.498231 |
0.52 |
0.52445368421053 |
$1,906,746 |
1906746.0675871 |
|
 Mike Benjamin
 |
Benjamin Mike |
3B |
$925,000 |
925000 |
2.21% |
2.21 |
-1.42 |
-1.41799 |
— |
0 |
— |
0 |
|
 Armando Rios
 |
Rios Armando |
RF |
$925,000 |
925000 |
2.21% |
2.21 |
-0.19 |
-0.1893 |
— |
0 |
— |
0 |
|
 Ron Villone
 |
Villone Ron |
RP |
$900,000 |
900000 |
2.15% |
2.15 |
0.94 |
0.935894 |
1.04 |
1.0398822222222 |
$961,647 |
961647.36604786 |
|
 Scott Sauerbeck
 |
Sauerbeck Scott |
RP |
$766,667 |
766667 |
1.83% |
1.83 |
1.91 |
1.9057 |
2.49 |
2.4856945714371 |
$402,302 |
402302.04124469 |
|
 Brian Boehringer
 |
Boehringer Brian |
RP |
$675,000 |
675000 |
1.61% |
1.61 |
0.52 |
0.523292 |
0.78 |
0.77524740740741 |
$1,289,911 |
1289910.7955023 |
|
 Keith Osik
 |
Osik Keith |
C |
$625,000 |
625000 |
1.49% |
1.49 |
-0.17 |
-0.167242 |
— |
0 |
— |
0 |
|
 Aramis Ramirez
 |
Ramirez Aramis |
3B |
$500,000 |
500000 |
1.19% |
1.19 |
-0.85 |
-0.848056 |
— |
0 |
— |
0 |
|
 Adrian Brown
 |
Brown Adrian |
CF |
$450,000 |
450000 |
1.07% |
1.07 |
-0.69 |
-0.692941 |
— |
0 |
— |
0 |
|
 Jimmy Anderson
 |
Anderson Jimmy |
RP |
$305,000 |
305000 |
0.73% |
0.73 |
-2.34 |
-2.34314 |
— |
0 |
— |
0 |
|
 Kip Wells
 |
Wells Kip |
RP |
$272,500 |
272500 |
0.65% |
0.65 |
3.08 |
3.07648 |
11.29 |
11.289834862385 |
$88,575 |
88575.254836696 |
|
 Mike Lincoln
 |
Lincoln Mike |
RP |
$267,500 |
267500 |
0.64% |
0.64 |
0.84 |
0.839129 |
3.14 |
3.1369308411215 |
$318,783 |
318782.92848895 |
|
 Dave Williams
 |
Williams Dave |
RP |
$234,000 |
234000 |
0.56% |
0.56 |
0.58 |
0.580598 |
2.48 |
2.481188034188 |
$403,033 |
403032.73521438 |
|
 Jack Wilson
 |
Wilson Jack |
SS |
$232,000 |
232000 |
0.55% |
0.55 |
2.72 |
2.72075 |
11.73 |
11.727370689655 |
$85,271 |
85270.605531563 |
|
 Craig Wilson
 |
Wilson Craig |
RF |
$229,000 |
229000 |
0.55% |
0.55 |
0.98 |
0.981342 |
4.29 |
4.2853362445415 |
$233,354 |
233353.91739068 |
|
 Rob Mackowiak
 |
Mackowiak Rob |
RF |
$227,000 |
227000 |
0.54% |
0.54 |
0.89 |
0.890725 |
3.92 |
3.9238986784141 |
$254,849 |
254848.57840523 |
|
 Joe Beimel
 |
Beimel Joe |
RP |
$227,000 |
227000 |
0.54% |
0.54 |
-0.28 |
-0.27699 |
— |
0 |
— |
0 |
|
 Chad Hermansen
 |
Hermansen Chad |
CF |
$223,000 |
223000 |
0.53% |
0.53 |
0.11 |
0.112547 |
0.50 |
0.50469506726457 |
$1,981,394 |
1981394.4396563 |
|
 Josh Fogg
 |
Fogg Josh |
RP |
$203,000 |
203000 |
0.48% |
0.48 |
0.43 |
0.433859 |
2.14 |
2.137236453202 |
$467,894 |
467893.94711185 |
|
| Year | Pirates payroll |
PR Sort |
Avg payroll |
AvgPR Sort |
Diff |
Diff Sort |
|---|
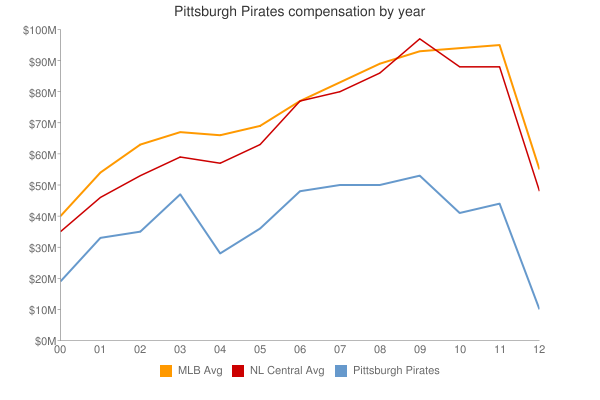
| 2000 | $27,423,334 | 27423334 | $55,368,142 | 55368142 | $-27,944,808 | -27944808 |
| 2001 | $56,110,833 | 56110833 | $64,937,084 | 64937084 | $-8,826,251 | -8826251 |
| 2002 | $41,911,099 | 41911099 | $67,238,672 | 67238672 | $-25,327,573 | -25327573 |
| 2003 | $54,761,833 | 54761833 | $70,654,480 | 70654480 | $-15,892,647 | -15892647 |
| 2004 | $30,716,500 | 30716500 | $69,466,729 | 69466729 | $-38,750,229 | -38750229 |
| 2005 | $36,170,500 | 36170500 | $74,114,841 | 74114841 | $-37,944,341 | -37944341 |
| 2006 | $47,700,750 | 47700750 | $79,621,815 | 79621815 | $-31,921,065 | -31921065 |
| 2007 | $41,444,500 | 41444500 | $85,537,470 | 85537470 | $-44,092,970 | -44092970 |
| 2008 | $49,113,225 | 49113225 | $92,003,799 | 92003799 | $-42,890,574 | -42890574 |
| 2009 | $51,864,000 | 51864000 | $92,169,598 | 92169598 | $-40,305,598 | -40305598 |
| 2010 | $38,668,000 | 38668000 | $94,342,601 | 94342601 | $-55,674,601 | -55674601 |
| 2011 | $44,485,667 | 44485667 | $96,974,710 | 96974710 | $-52,489,043 | -52489043 |
| 2012 | $51,932,000 | 51932000 | $100,947,217 | 100947217 | $-49,015,217 | -49015217 |
| 2013 | $66,805,000 | 66805000 | $108,586,966 | 108586966 | $-41,781,966 | -41781966 |
| 2014 | $71,929,333 | 71929333 | $117,131,361 | 117131361 | $-45,202,028 | -45202028 |
| 2015 | $90,303,000 | 90303000 | $126,168,161 | 126168161 | $-35,865,161 | -35865161 |
| 2016 | $99,945,500 | 99945500 | $131,756,569 | 131756569 | $-31,811,069 | -31811069 |
| 2017 | $95,807,004 | 95807004 | $136,337,445 | 136337445 | $-40,530,441 | -40530441 |
| 2018 | $86,340,001 | 86340001 | $135,360,600 | 135360600 | $-49,020,599 | -49020599 |
| 2019 | $74,808,000 | 74808000 | $134,792,134 | 134792134 | $-59,984,134 | -59984134 |
| 2020 | $53,939,500 | 53939500 | $139,496,467 | 139496467 | $-85,556,967 | -85556967 |
| 2021 | $55,452,000 | 55452000 | $130,712,288 | 130712288 | $-75,260,288 | -75260288 |
| 2022 | $55,761,800 | 55761800 | $149,802,695 | 149802695 | $-94,040,895 | -94040895 |
| 2023 | $72,777,500 | 72777500 | $161,692,345 | 161692345 | $-88,914,845 | -88914845 |
| 2024 | $53,029,000 | 53029000 | $136,306,249 | 136306249 | $-83,277,249 | -83277249 |
| 2025 | $34,661,500 | 34661500 | $98,329,527 | 98329527 | $-63,668,027 | -63668027 |
| 2026 | $38,161,500 | 38161500 | $78,039,273 | 78039273 | $-39,877,773 | -39877773 |
| 2027 | $40,661,500 | 40661500 | $60,919,343 | 60919343 | $-20,257,843 | -20257843 |
| 2028 | $43,661,500 | 43661500 | $46,901,712 | 46901712 | $-3,240,212 | -3240212 |
| 2029 | $23,250,000 | 23250000 | $38,597,944 | 38597944 | $-15,347,944 | -15347944 |
| 2030 | $21,250,000 | 21250000 | $41,447,579 | 41447579 | $-20,197,579 | -20197579 |
| 2031 | $2,000,000 | 2000000 | $38,360,152 | 38360152 | $-36,360,152 | -36360152 |
|
 2002 Pittsburgh Pirates