| Player | Player Sort | Pos | Salary | Salary Sort | Pct | Pct Sort | WARP | WARP Sort | WARP/$M | WARP/$M Sort | $/WARP | $/WARP Sort | Current Status |
|---|
 Scott Rolen
 |
Rolen Scott |
3B |
$8,600,000 |
8600000 |
14.78% |
14.78 |
3.02 |
3.01615 |
0.35 |
0.35071511627907 |
$2,851,317 |
2851317.0764054 |
|
 Mike Lieberthal
 |
Lieberthal Mike |
C |
$7,333,333 |
7333333 |
12.61% |
12.61 |
2.58 |
2.58255 |
0.35 |
0.35216592509845 |
$2,839,571 |
2839570.579466 |
|
 Bobby Abreu
 |
Abreu Bobby |
RF |
$6,333,333 |
6333333 |
10.89% |
10.89 |
5.63 |
5.62926 |
0.89 |
0.88883057309635 |
$1,125,074 |
1125073.8107673 |
|
 Robert Person
 |
Person Robert |
RP |
$6,250,000 |
6250000 |
10.74% |
10.74 |
-0.78 |
-0.783022 |
— |
0 |
— |
0 |
|
 Jose Mesa
 |
Mesa Jose |
RP |
$4,200,000 |
4200000 |
7.22% |
7.22 |
0.65 |
0.653523 |
0.16 |
0.15560071428571 |
$6,426,706 |
6426705.7165547 |
|
 Doug Glanville
 |
Glanville Doug |
CF |
$4,000,000 |
4000000 |
6.88% |
6.88 |
-0.30 |
-0.302576 |
— |
0 |
— |
0 |
|
 Travis Lee
 |
Lee Travis |
1B |
$3,000,000 |
3000000 |
5.16% |
5.16 |
0.58 |
0.581725 |
0.19 |
0.19390833333333 |
$5,157,076 |
5157075.9379432 |
|
 Turk Wendell
 |
Wendell Turk |
DNP |
$2,950,000 |
2950000 |
5.07% |
5.07 |
— |
0.00 |
— |
0 |
— |
0 |
|
 Rheal Cormier
 |
Cormier Rheal |
RP |
$2,883,333 |
2883333 |
4.96% |
4.96 |
0.94 |
0.941081 |
0.33 |
0.32638651172098 |
$3,063,852 |
3063852.1019976 |
|
 Terry Adams
 |
Adams Terry |
RP |
$2,700,000 |
2700000 |
4.64% |
4.64 |
1.92 |
1.91626 |
0.71 |
0.70972592592593 |
$1,408,995 |
1408994.6040725 |
|
 Pat Burrell
 |
Burrell Pat |
LF |
$1,905,000 |
1905000 |
3.28% |
3.28 |
5.21 |
5.20845 |
2.73 |
2.734094488189 |
$365,752 |
365751.80715952 |
|
 Ricky Bottalico
 |
Bottalico Ricky |
RP |
$1,500,000 |
1500000 |
2.58% |
2.58 |
0.14 |
0.136428 |
0.09 |
0.090952 |
$10,994,810 |
10994810.449468 |
|
 Ricky Ledee
 |
Ledee Ricky |
PH |
$750,000 |
750000 |
1.29% |
1.29 |
0.57 |
0.574914 |
0.77 |
0.766552 |
$1,304,543 |
1304542.9403354 |
|
 Jose Santiago
 |
Santiago Jose |
RP |
$700,000 |
700000 |
1.20% |
1.20 |
0.28 |
0.275501 |
0.39 |
0.39357285714286 |
$2,540,826 |
2540825.6231375 |
|
 Todd Pratt
 |
Pratt Todd |
C |
$650,000 |
650000 |
1.12% |
1.12 |
1.73 |
1.7286 |
2.66 |
2.6593846153846 |
$376,027 |
376026.84253153 |
|
 John Mabry
 |
Mabry John |
PH |
$500,000 |
500000 |
0.86% |
0.86 |
-0.06 |
-0.0638599 |
— |
0 |
— |
0 |
|
 Tomas Perez
 |
Perez Tomas |
2B |
$475,000 |
475000 |
0.82% |
0.82 |
0.62 |
0.622077 |
1.31 |
1.3096357894737 |
$763,571 |
763571.06917632 |
|
 Randy Wolf
 |
Wolf Randy |
RP |
$450,000 |
450000 |
0.77% |
0.77 |
5.81 |
5.805 |
12.90 |
12.9 |
$77,519 |
77519.379844961 |
|
 Marlon Anderson
 |
Anderson Marlon |
2B |
$400,000 |
400000 |
0.69% |
0.69 |
0.21 |
0.20613 |
0.52 |
0.515325 |
$1,940,523 |
1940522.9709407 |
|
 Dave Hollins
 |
Hollins Dave |
1B |
$400,000 |
400000 |
0.69% |
0.69 |
-0.21 |
-0.20748 |
— |
0 |
— |
0 |
|
 Jimmy Rollins
 |
Rollins Jimmy |
SS |
$355,000 |
355000 |
0.61% |
0.61 |
2.23 |
2.23305 |
6.29 |
6.2902816901408 |
$158,975 |
158975.39240053 |
|
 Hector Mercado
 |
Mercado Hector |
RP |
$255,000 |
255000 |
0.44% |
0.44 |
0.59 |
0.592723 |
2.32 |
2.3244039215686 |
$430,218 |
430217.82518984 |
|
 Cliff Politte
 |
Politte Cliff |
RP |
$245,000 |
245000 |
0.42% |
0.42 |
0.37 |
0.37088 |
1.51 |
1.5137959183673 |
$660,591 |
660591.0267472 |
|
 Vicente Padilla
 |
Padilla Vicente |
RP |
$245,000 |
245000 |
0.42% |
0.42 |
3.62 |
3.62079 |
14.78 |
14.778734693878 |
$67,665 |
67664.791385305 |
|
 David Coggin
 |
Coggin David |
RP |
$240,000 |
240000 |
0.41% |
0.41 |
0.04 |
0.0356525 |
0.15 |
0.14855208333333 |
$6,731,646 |
6731645.7471426 |
|
 Brandon Duckworth
 |
Duckworth Brandon |
RP |
$235,000 |
235000 |
0.40% |
0.40 |
4.57 |
4.56615 |
19.43 |
19.430425531915 |
$51,466 |
51465.67677365 |
|
 Ryan Vogelsong
 |
Vogelsong Ryan |
DNP |
$212,500 |
212500 |
0.37% |
0.37 |
— |
0.00 |
— |
0 |
— |
0 |
|
 Carlos Silva
 |
Silva Carlos |
RP |
$200,000 |
200000 |
0.34% |
0.34 |
0.12 |
0.116106 |
0.58 |
0.58053 |
$1,722,564 |
1722563.8640553 |
|
 Nick Punto
 |
Punto Nick |
PH |
$200,000 |
200000 |
0.34% |
0.34 |
-0.15 |
-0.148939 |
— |
0 |
— |
0 |
|
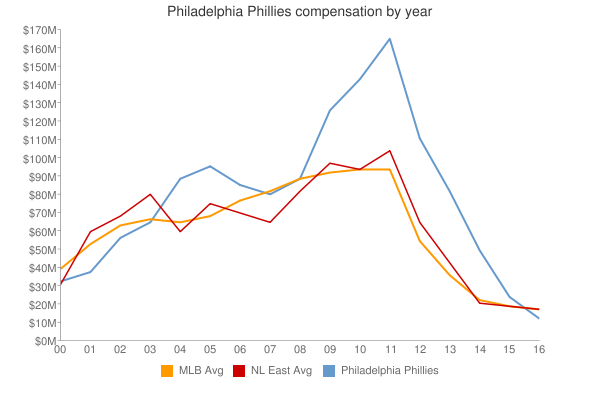
| Year | Phillies payroll |
PR Sort |
Avg payroll |
AvgPR Sort |
Diff |
Diff Sort |
|---|
| 2000 | $47,011,333 | 47011333 | $55,368,142 | 55368142 | $-8,356,809 | -8356809 |
| 2001 | $41,911,166 | 41911166 | $64,937,084 | 64937084 | $-23,025,918 | -23025918 |
| 2002 | $58,167,499 | 58167499 | $67,238,672 | 67238672 | $-9,071,173 | -9071173 |
| 2003 | $69,676,667 | 69676667 | $70,654,480 | 70654480 | $-977,813 | -977813 |
| 2004 | $92,444,167 | 92444167 | $69,466,729 | 69466729 | $22,977,438 | 22977438 |
| 2005 | $95,625,667 | 95625667 | $74,114,841 | 74114841 | $21,510,826 | 21510826 |
| 2006 | $87,642,000 | 87642000 | $79,621,815 | 79621815 | $8,020,185 | 8020185 |
| 2007 | $89,839,547 | 89839547 | $85,537,470 | 85537470 | $4,302,077 | 4302077 |
| 2008 | $96,735,047 | 96735047 | $92,003,799 | 92003799 | $4,731,248 | 4731248 |
| 2009 | $131,087,380 | 131087380 | $92,169,598 | 92169598 | $38,917,782 | 38917782 |
| 2010 | $144,178,379 | 144178379 | $94,342,601 | 94342601 | $49,835,778 | 49835778 |
| 2011 | $165,976,381 | 165976381 | $96,974,710 | 96974710 | $69,001,671 | 69001671 |
| 2012 | $172,093,283 | 172093283 | $100,947,217 | 100947217 | $71,146,066 | 71146066 |
| 2013 | $160,585,714 | 160585714 | $108,586,966 | 108586966 | $51,998,748 | 51998748 |
| 2014 | $178,729,967 | 178729967 | $117,131,361 | 117131361 | $61,598,606 | 61598606 |
| 2015 | $147,889,666 | 147889666 | $126,168,161 | 126168161 | $21,721,505 | 21721505 |
| 2016 | $95,846,667 | 95846667 | $131,756,569 | 131756569 | $-35,909,902 | -35909902 |
| 2017 | $100,041,000 | 100041000 | $136,337,445 | 136337445 | $-36,296,445 | -36296445 |
| 2018 | $95,270,301 | 95270301 | $135,360,600 | 135360600 | $-40,090,299 | -40090299 |
| 2019 | $140,611,962 | 140611962 | $134,792,134 | 134792134 | $5,819,828 | 5819828 |
| 2020 | $177,129,962 | 177129962 | $139,496,467 | 139496467 | $37,633,495 | 37633495 |
| 2021 | $191,091,962 | 191091962 | $130,712,288 | 130712288 | $60,379,674 | 60379674 |
| 2022 | $228,976,529 | 228976529 | $149,802,695 | 149802695 | $79,173,834 | 79173834 |
| 2023 | $242,776,106 | 242776106 | $161,692,345 | 161692345 | $81,083,761 | 81083761 |
| 2024 | $221,985,285 | 221985285 | $136,306,249 | 136306249 | $85,679,036 | 85679036 |
| 2025 | $221,274,285 | 221274285 | $98,329,527 | 98329527 | $122,944,758 | 122944758 |
| 2026 | $159,882,618 | 159882618 | $78,039,273 | 78039273 | $81,843,345 | 81843345 |
| 2027 | $121,382,618 | 121382618 | $60,919,343 | 60919343 | $60,463,275 | 60463275 |
| 2028 | $79,382,618 | 79382618 | $46,901,712 | 46901712 | $32,480,906 | 32480906 |
| 2029 | $75,382,618 | 75382618 | $38,597,944 | 38597944 | $36,784,674 | 36784674 |
| 2030 | $75,382,618 | 75382618 | $41,447,579 | 41447579 | $33,935,039 | 33935039 |
| 2031 | $50,811,189 | 50811189 | $38,360,152 | 38360152 | $12,451,037 | 12451037 |
| 2032 | $27,272,727 | 27272727 | $47,925,459 | 47925459 | $-20,652,732 | -20652732 |
| 2033 | $27,272,730 | 27272730 | $43,068,924 | 43068924 | $-15,796,194 | -15796194 |
|
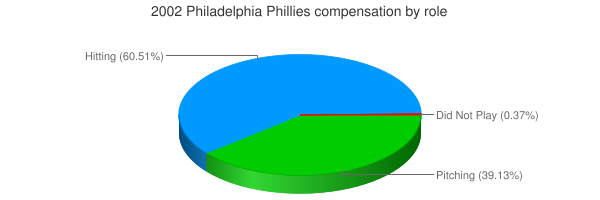
 2002 Philadelphia Phillies