| Player | Player Sort | Pos | Salary | Salary Sort | Pct | Pct Sort | WARP | WARP Sort | WARP/$M | WARP/$M Sort | $/WARP | $/WARP Sort | Current Status |
|---|
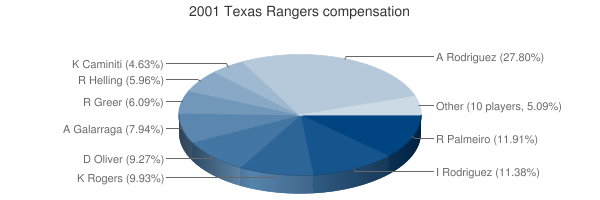
 Alex Rodriguez
 |
Rodriguez Alex |
SS |
$22,000,000 |
22000000 |
25.05% |
25.05 |
8.08 |
8.07874 |
0.37 |
0.36721545454545 |
$2,723,197 |
2723196.9341754 |
|
 Rafael Palmeiro
 |
Palmeiro Rafael |
1B |
$9,000,000 |
9000000 |
10.25% |
10.25 |
4.30 |
4.3031 |
0.48 |
0.47812222222222 |
$2,091,515 |
2091515.4191165 |
|
 Ivan Rodriguez
 |
Rodriguez Ivan |
C |
$8,600,000 |
8600000 |
9.79% |
9.79 |
4.88 |
4.88091 |
0.57 |
0.5675476744186 |
$1,761,967 |
1761966.5185386 |
|
 Kenny Rogers
 |
Rogers Kenny |
RP |
$7,500,000 |
7500000 |
8.54% |
8.54 |
-1.45 |
-1.44686 |
— |
0 |
— |
0 |
|
 Darren Oliver
 |
Oliver Darren |
RP |
$7,000,000 |
7000000 |
7.97% |
7.97 |
-0.90 |
-0.903371 |
— |
0 |
— |
0 |
|
 Andres Galarraga
 |
Galarraga Andres |
DH |
$6,000,000 |
6000000 |
6.83% |
6.83 |
-0.25 |
-0.245217 |
— |
0 |
— |
0 |
|
 Rusty Greer
 |
Greer Rusty |
LF |
$4,600,000 |
4600000 |
5.24% |
5.24 |
0.73 |
0.725519 |
0.16 |
0.15772152173913 |
$6,340,289 |
6340288.8139387 |
|
 Rick Helling
 |
Helling Rick |
RP |
$4,500,000 |
4500000 |
5.12% |
5.12 |
-0.96 |
-0.956172 |
— |
0 |
— |
0 |
|
 Ken Caminiti
 |
Caminiti Ken |
3B |
$3,500,000 |
3500000 |
3.99% |
3.99 |
0.50 |
0.502164 |
0.14 |
0.14347542857143 |
$6,969,835 |
6969834.5560415 |
|
 Randy Velarde
 |
Velarde Randy |
2B |
$3,150,000 |
3150000 |
3.59% |
3.59 |
1.32 |
1.31946 |
0.42 |
0.41887619047619 |
$2,387,340 |
2387340.2755673 |
|
 Mark Petkovsek
 |
Petkovsek Mark |
RP |
$2,050,000 |
2050000 |
2.33% |
2.33 |
-1.41 |
-1.41289 |
— |
0 |
— |
0 |
|
 Chad Curtis
 |
Curtis Chad |
CF |
$1,900,000 |
1900000 |
2.16% |
2.16 |
0.69 |
0.686231 |
0.36 |
0.36117421052632 |
$2,768,747 |
2768746.9671291 |
|
 Justin Thompson
 |
Thompson Justin |
DNP |
$1,420,000 |
1420000 |
1.62% |
1.62 |
— |
0.00 |
— |
0 |
— |
0 |
|
 Tim Crabtree
 |
Crabtree Tim |
RP |
$1,300,000 |
1300000 |
1.48% |
1.48 |
-0.19 |
-0.191152 |
— |
0 |
— |
0 |
|
 Frank Catalanotto
 |
Catalanotto Frank |
LF |
$850,000 |
850000 |
0.97% |
0.97 |
3.65 |
3.65345 |
4.30 |
4.2981764705882 |
$232,657 |
232656.80384294 |
|
 Bill Haselman
 |
Haselman Bill |
C |
$800,000 |
800000 |
0.91% |
0.91 |
-0.14 |
-0.142071 |
— |
0 |
— |
0 |
|
 Jeff Brantley
 |
Brantley Jeff |
RP |
$650,000 |
650000 |
0.74% |
0.74 |
-0.22 |
-0.224303 |
— |
0 |
— |
0 |
|
 Pat Mahomes
 |
Mahomes Pat |
RP |
$500,000 |
500000 |
0.57% |
0.57 |
-2.68 |
-2.67914 |
— |
0 |
— |
0 |
|
 Gabe Kapler
 |
Kapler Gabe |
CF |
$450,000 |
450000 |
0.51% |
0.51 |
2.04 |
2.04389 |
4.54 |
4.5419777777778 |
$220,168 |
220168.40436618 |
|
 Ricky Ledee
 |
Ledee Ricky |
RF |
$406,500 |
406500 |
0.46% |
0.46 |
-0.43 |
-0.427873 |
— |
0 |
— |
0 |
|
 Mike Venafro
 |
Venafro Mike |
RP |
$310,000 |
310000 |
0.35% |
0.35 |
-0.84 |
-0.837452 |
— |
0 |
— |
0 |
|
 Jeff Zimmerman
 |
Zimmerman Jeff |
RP |
$307,500 |
307500 |
0.35% |
0.35 |
1.60 |
1.59809 |
5.20 |
5.1970406504065 |
$192,417 |
192417.19803015 |
|
 Doug Mirabelli
 |
Mirabelli Doug |
C |
$295,000 |
295000 |
0.34% |
0.34 |
0.75 |
0.754386 |
2.56 |
2.5572406779661 |
$391,046 |
391046.4934397 |
|
 Francisco Cordero
 |
Cordero Francisco |
RP |
$277,500 |
277500 |
0.32% |
0.32 |
0.00 |
0.00270219 |
0.01 |
0.0097376216216216 |
$102,694,481 |
102694481.14307 |
|
 Doug Davis
 |
Davis Doug |
RP |
$250,000 |
250000 |
0.28% |
0.28 |
0.20 |
0.198467 |
0.79 |
0.793868 |
$1,259,655 |
1259655.2575491 |
|
 Dan Kolb
 |
Kolb Dan |
RP |
$202,500 |
202500 |
0.23% |
0.23 |
0.26 |
0.257855 |
1.27 |
1.2733580246914 |
$785,325 |
785325.08580404 |
|
| Year | Rangers payroll |
PR Sort |
Avg payroll |
AvgPR Sort |
Diff |
Diff Sort |
|---|
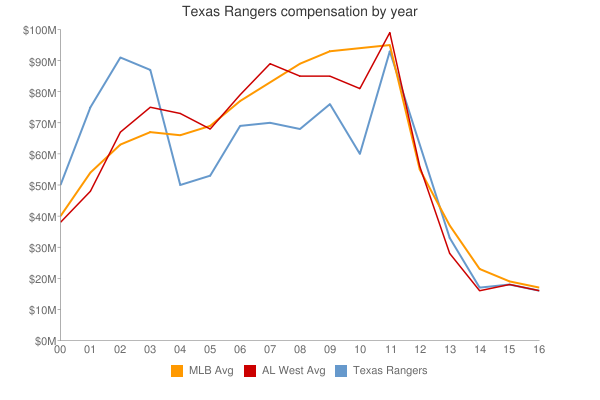
| 2000 | $69,920,921 | 69920921 | $55,368,142 | 55368142 | $14,552,779 | 14552779 |
| 2001 | $87,819,000 | 87819000 | $64,937,084 | 64937084 | $22,881,916 | 22881916 |
| 2002 | $105,876,122 | 105876122 | $67,238,672 | 67238672 | $38,637,450 | 38637450 |
| 2003 | $102,531,667 | 102531667 | $70,654,480 | 70654480 | $31,877,187 | 31877187 |
| 2004 | $55,302,917 | 55302917 | $69,466,729 | 69466729 | $-14,163,812 | -14163812 |
| 2005 | $56,670,500 | 56670500 | $74,114,841 | 74114841 | $-17,444,341 | -17444341 |
| 2006 | $68,894,360 | 68894360 | $79,621,815 | 79621815 | $-10,727,455 | -10727455 |
| 2007 | $70,934,240 | 70934240 | $85,537,470 | 85537470 | $-14,603,230 | -14603230 |
| 2008 | $68,081,980 | 68081980 | $92,003,799 | 92003799 | $-23,921,819 | -23921819 |
| 2009 | $76,255,380 | 76255380 | $92,169,598 | 92169598 | $-15,914,218 | -15914218 |
| 2010 | $58,490,000 | 58490000 | $94,342,601 | 94342601 | $-35,852,601 | -35852601 |
| 2011 | $96,713,370 | 96713370 | $96,974,710 | 96974710 | $-261,340 | -261340 |
| 2012 | $127,289,900 | 127289900 | $100,947,217 | 100947217 | $26,342,683 | 26342683 |
| 2013 | $125,340,100 | 125340100 | $108,586,966 | 108586966 | $16,753,134 | 16753134 |
| 2014 | $133,525,939 | 133525939 | $117,131,361 | 117131361 | $16,394,578 | 16394578 |
| 2015 | $143,733,540 | 143733540 | $126,168,161 | 126168161 | $17,565,379 | 17565379 |
| 2016 | $150,955,390 | 150955390 | $131,756,569 | 131756569 | $19,198,821 | 19198821 |
| 2017 | $165,348,063 | 165348063 | $136,337,445 | 136337445 | $29,010,618 | 29010618 |
| 2018 | $133,137,626 | 133137626 | $135,360,600 | 135360600 | $-2,222,974 | -2222974 |
| 2019 | $118,274,435 | 118274435 | $134,792,134 | 134792134 | $-16,517,699 | -16517699 |
| 2020 | $151,058,666 | 151058666 | $139,496,467 | 139496467 | $11,562,199 | 11562199 |
| 2021 | $96,241,250 | 96241250 | $130,712,288 | 130712288 | $-34,471,038 | -34471038 |
| 2022 | $143,943,834 | 143943834 | $149,802,695 | 149802695 | $-5,858,861 | -5858861 |
| 2023 | $196,608,190 | 196608190 | $161,692,345 | 161692345 | $34,915,845 | 34915845 |
| 2024 | $195,275,000 | 195275000 | $136,306,249 | 136306249 | $58,968,751 | 58968751 |
| 2025 | $138,750,000 | 138750000 | $98,329,527 | 98329527 | $40,420,473 | 40420473 |
| 2026 | $95,500,000 | 95500000 | $78,039,273 | 78039273 | $17,460,727 | 17460727 |
| 2027 | $94,500,000 | 94500000 | $60,919,343 | 60919343 | $33,580,657 | 33580657 |
| 2028 | $51,500,000 | 51500000 | $46,901,712 | 46901712 | $4,598,288 | 4598288 |
| 2029 | $31,500,000 | 31500000 | $38,597,944 | 38597944 | $-7,097,944 | -7097944 |
| 2030 | $31,500,000 | 31500000 | $41,447,579 | 41447579 | $-9,947,579 | -9947579 |
| 2031 | $31,500,000 | 31500000 | $38,360,152 | 38360152 | $-6,860,152 | -6860152 |
|
 2001 Texas Rangers


