 24 comments have been left for this article.
BP Comment Quick Links

|

|
February 24, 2009 Getting DefensiveAdventures in Team Fielding
What Moneyball did for on-base percentage, the Rays' 2008 triumph may have done for defense—even if the book on the latter has yet to be written (although it's reportedly on its way). Of course, the importance of avoiding outs at the plate, and of accumulating them in the field, was as clear to Lane and Chadwick, respectively, as it is to Beane and Friedman; the rest of the class merely needed a little prodding to send it plunging past the tipping point. Unfortunately for those prematurely in the know, these watershed moments often mark the end of their salad days, as other prospectors make inroads on their fertile claims. The rubes are growing scarce: just ask Manny Ramirez, Adam Dunn, Bobby Abreu, and the other defensively challenged sluggers who failed to douse themselves with eau de Ibañez before seeking long-term relationships this winter. An appreciation for on-base percentage could have yielded a competitive advantage at any point in the game's history, but until fairly recently, fielding skills remained relatively impenetrable, even to those with the inclination to evaluate them. However, as defensive metrics improve and become increasingly reliable (a process which the imminent arrival of the Hit-f/x system promises to accelerate), the leathery component of run prevention will assume an even greater significance in player evaluation and analysis (while remaining an area in which scouting insight can elucidate persistent quirks in the numbers). In order to determine just how large a slice of the run-prevention pie defense deserves to consume, we might take a quick look back at an earlier investigation. Steven Goldman devoted a chapter of Baseball Between the Numbers to examining the relative importance of run scoring and run prevention in an attempt to answer the question, "Can a team have too much pitching?" The abridged version of his answer, as one might expect, was "no." His more nuanced conclusion, however, stated that "you can't have too much pitching—except when you don't have enough of everything else." For the purposes of his essay, "everything else" was limited to offense, but we can take some limited steps to extend the discussion to defense—in Steven's words, "the invisible hand that affects much of what we perceive as pitching"—despite the difficulty of separating the pitcher's work from that of the fielders behind him. As part of our inquiry, we can assess the relative impacts of pitching and defense on run prevention, and, by extension, winning. A one-point swing in defensive efficiency, in either direction, constitutes a difference of roughly four hits over a full season. Assuming a typical distribution of singles, doubles, and triples (and multiplying by their respective expected-run values), those four hits amount to approximately 2.2 runs. To analyze pitching's effects without muddying the waters with defensive contributions, we'll use QuikERA, a handy tool developed (and explained here) by Nate Silver, which estimates a pitcher's ERA based solely on his defense-independent strikeout rate, walk rate, and GB/FB ratio. A .01 addition or subtraction in QERA translates to a difference of approximately 1.77 runs allowed by a team over the course of a season, or almost exactly four-fifths that of a .001 fluctuation in defensive efficiency. The following graphs display the payoff in wins as a factor of improvements in defensive efficiency and QERA, according to Bill James' simple Pythagorean expectation formula:
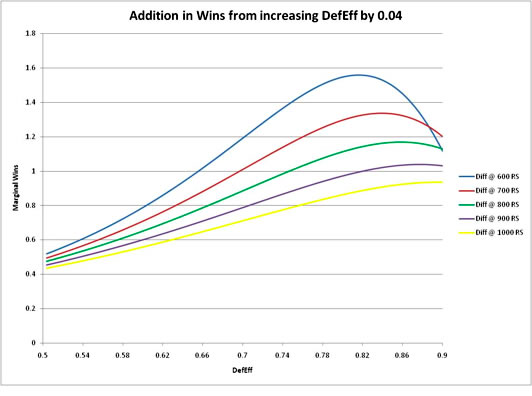
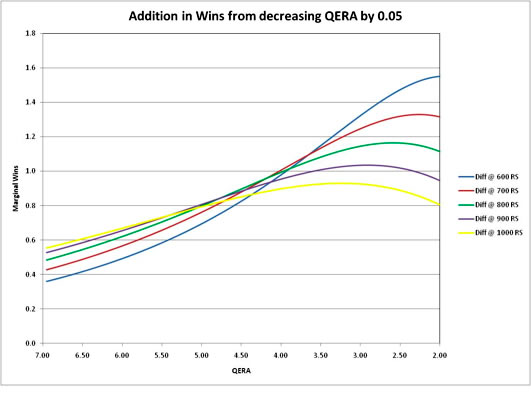 Since fluctuations in both defensive efficiency and QERA affect only the "runs allowed" portion of the run-expectation formula, these graphs have little comparative value, but it's still helpful to visualize the gains which even modest improvements in either category can yield. The fewer the runs which one can hope to receive from one's own batters, the more valuable the suppression of the opposition's lineup becomes. Teams which dramatically improved their defensive efficiency or QERA in a single year provide real-world examples of the benefits awaiting aspiring run preventers. Here are the top 20 teams in each category since 1954, along with their average improvements in winning percentage:
               Differences In
Year  Team      DefEff  WPct
2008  Rays       .054   .192
1980  Athletics  .048   .182
1981  Rangers    .046   .071
1981  Tigers     .035   .031
1991  Braves     .035   .179
1988  Brewers    .033  -.025
1971  Giants     .032   .025
2008  Marlins    .031   .084
1955  Cubs       .030   .050
1997  Tigers     .029   .161
1991  Angels     .028   .006
1971  Astros     .027  -.001
1965  Pirates    .027   .062
1985  Giants     .027  -.024
1992  Brewers    .027   .056
1998  Red Sox    .026   .087
2001  Twins      .026   .099
1968  Indians    .026   .071
1982  Padres     .025   .127
2005  Indians    .025   .080
Average                 .076


               Differences In
Year  Team       QERA   WPct
1963  Indians    -.88  -.006
1997  Brewers    -.86  -.010
2001  Athletics  -.85   .065
2001  Yankees    -.84   .054
1974  Rangers    -.83   .170
1997  Tigers     -.81   .161
2001  Cubs       -.78   .142
1984  Mets       -.76   .136
1963  Cubs       -.75   .142
1994  Expos      -.74   .069
1993  Mariners   -.72   .111
2001  Astros     -.72   .130
1997  Blue Jays  -.70   .012
1994  Padres     -.70   .025
1971  White Sox  -.69   .142
1958  Braves     -.69  -.021
1997  Mariners   -.69   .028
2004  Tigers     -.68   .179
1977  Dodgers    -.67   .037
1998  Padres     -.67   .136
AVG:                    .085
The teams which recorded historically large one-year boosts in QERA enjoyed slightly higher gains than those which tallied similarly pronounced increases in defensive efficiency. However, like most "before and after" tableaux, this juxtaposition omits a portion of the story: in a sample of this size, offensive disparities may account for some, or all, of the difference between the groups. Setting offense aside for the moment, we might ask whether it's wiser for a team to invest its fortunes in one element of run prevention, in pursuit of a stunning reversal like those above, or to distribute its finite resources in a more even-handed manner. Again, history supplies us with a possible answer. One hundred and twenty-seven teams in baseball history have finished with the same league ranks in defensive efficiency and QERA, posting a collective winning percentage of .504. The 127 teams with the greatest disparity between their league ranks in defensive efficiency and QERA have registered a slightly higher .507 winning percentage. Of course, these numbers are misleading, because the list of the 127 most balanced teams also includes teams that were balanced in a bad way—near the bottom of the league in both categories. All of the 127 least-balanced teams, in contrast, were at or near the top of their leagues in one of the categories. The worst average rank ((defensive efficiency rank + QERA rank)/2) of any of these least-balanced teams was 10.5 (the 2006 Washington Nationals, who ranked 16th in the NL in QERA and seventh in the NL in defensive efficiency). Only three had an average rank of 10th or worse. In contrast, two of the most-balanced teams finished with average ranks of 16, and twenty-three of them finished with average ranks of 11 or worse. If we eliminate these twenty-three well-balanced failures, we're left with 104 well-balanced teams with an average rank less than or equal to 10th, and a collective winning percentage of .518. The 104 least-balanced teams, on the other hand, amassed a collective winning percentage of .506. Again, offense plays a role here, but these findings suggest that it pays, albeit slightly, to devote equal care to both aspects of run prevention, rather than placing one's fate entirely in either the hands that throw the ball, or the hands that catch it. This conclusion is born out by a survey of some of the last decade's most successful squads. Most of the 22 pennant-winners since the last round of expansion in 1998 have ridden balanced approaches to run prevention deep into October: AL Differences In Rank Year Team DefEff QERA 2008 Rays 1 6 2007 Red Sox 1 3 2006 Tigers 1 7 2005 White Sox 2 4 2004 Red Sox 5 1 2003 Yankees 13 1 2002 Angels 1 7 2001 Yankees 9 1 2000 Yankees 4 6 1999 Yankees 2 2 1998 Yankees 1 1 Average 4 4 NL Differences In Rank Year Team DefEff QERA 2008 Phillies 6 8 2007 Rockies 4 10 2006 Cardinals 6 10 2005 Astros 1 1 2004 Cardinals 2 3 2003 Marlins 9 5 2002 Giants 4 12 2001 D'backs 2 1 2000 Mets 4 4 1999 Braves 6 2 1998 Padres 7 2 Average 5 5 Since 1954, 111 teams (counting ties) have topped their leagues in defensive efficiency, racking up a collective .563 winning percentage along the way. As it happens, an identical number of squads have paced their circuits in QERA during the same period, finishing at .558. The moral of this story? Preventing opposition scoring is a winning strategy, no matter what route one takes to pursue it. Although Steven was referring to offense when he wrote that "in the absence of available pitching, making other changes will work just as well," the same statement holds true for defense. Still, while the evidence suggests that improving team defense can be an effective alternative to hoarding hurlers, whether a team should elect to invest its available funds in pitching or defense depends largely on the state of the talent market, and the unique circumstances of the club in question. The graphs above evince the benefits of improving defensive efficiency and QERA, but they can't tell us which of the two is easier to fortify. A vote for pitching usually funnels aid through the proper channels without springing a leak elsewhere on the roster, while the addition of a defensive whiz often exacts a toll on the offensive side of the ball. However, even in these more enlightened times, a mediocre moundsman may command a higher price than a superlative defender, whose contributions might be more easily overlooked or underestimated. The window may be closing, but as long as this state of affairs persists, teams with average run production, pitching, and defense would be wise to channel their resources along the path of least resistance. Moreover, as Keith Woolner and Dayn Perry observed in a separate BBTN chapter, the pitcher that you get only rarely becomes the pitcher you paid for, "given the precision demanded by pitching, the ability of opposing hitters to crush weak pitches, and the risk of injury inherent in the physical act of throwing a baseball." The greater consistency offered by defensive acquisitions represents a compelling argument in favor of making them the foundation of a winter's retooling. Furthermore, good defense makes pitchers look better, a phenomenon which has implications not only for fantasy baseball, but for the genuine article. Pitchers whose traditional stats are inflated by the human safety nets surrounding them may bring a greater return in trade than they deserve, especially from those who fail to examine their underlying performance closely. It's not difficult to imagine a scenario in which a superior defensive team could consistently mint superficially league-average starters, only to convert them into more valuable commodities by convincing gullible takers in more hostile environs to roll out the welcome mat; witness Greg Smith's inclusion as a nominal piece of the return in the deal which sent Matt Holliday from Colorado (14th in the NL in defensive efficiency) to Oakland (third in the AL). It's also worth noting that while the presence of a superior pitching staff bestows little or no advantage on its supporting fielders (all anecdotal reports of efficient workers "keeping fielders on their toes" aside), the construction of a capable fielding unit can confer tangible benefits upon a team's valuable arms beyond those merely cosmetic perquisites mentioned in the preceding paragraph. As noted in the Rays team essay in BP2K8, a strong defense can hasten and enrich the development of a young pitching staff, "with effects on the order of 20 to 30 points of long-term ERA." In addition, adept glove work enables pitchers to work more efficiently, reducing the incidence of wasted pitches over the course of a season, and indirectly reducing the workload shouldered by a team's complement of relievers. Last year's Rays vaulted to the top of the defensive efficiency differential leaderboard—and, despite posting a QERA nearly identical to their 2007 mark, the AL East—primarily by re-shuffling assets (B.J. Upton, Akinori Iwamura, and Evan Longoria) which were already under club control; the team's primary outside defensive acquisition, Jason Bartlett, failed to perform as expected in the field. Other organizations have taken note: the new Mariners regime's emphasis on outfield defense in the face of a largely inflexible starting rotation, smacks of a lesson well-learned, and the Yankees' fixation on high-strikeout starters, who minimize the damage done by porous defensive units, represents something more than a visceral reaction to an overdose of Sidney Ponson (landing Mark Teixeira and allowing Jason Giambi and Bobby Abreu to do what they do best—walk—should compound the benefits). The allure of the Rays' resounding success will continue to encourage copycats, especially if the defending AL champions manage to power through the plexiglass this season. Next off-season's weak free-agent class might provide further inducement to pursue the stealth approach, as the teams which miss out on the few choice cuts available scramble for the most savory gristle. Since fielding contributions remain the most difficult to quantify, as well as the least easily observed with the naked eye, defensive specialists may find themselves riding home in a number of doggy bags—and, perhaps to the surprise of their new owners, feeding the whole family. The Tampa Bay approach isn't suited to every roster, and most teams that adopt it will find the path from ignominy to respectability far smoother than the one leading thence to contention. Still, good gloves tend to sprout more readily on the farm than do MLB-ready arms, making it a sound strategy in the aggregate. Which is not to suggest that the Orioles may have stolen away with the annual AL East arms race by eschewing the likes of Sabathia, Burnett, and Smoltz in favor of Cesar Izturis—the big-ticket items usually do reserve admittance to the most desirable show. Nonetheless, as last year's high-QERA, low-defensive efficiency Yankees, Diamondbacks, and Reds discovered, procuring pitching without addressing underlying defensive woes is like using an HDTV to display SD sources: you simply won't end up with the pretty picture you thought you were paying for. Thanks to Bil Burke and others for research assistance. Ben Lindbergh is an intern with Baseball Prospectus and a student at Georgetown University. You can contact Ben by clicking here.
Ben Lindbergh is an author of Baseball Prospectus. Follow @benlindbergh
|
Welcome, Ben!