


 12 comments have been left for this article.
 BP Comment Quick Links

|

|
January 5, 2017 Flu-Like SymptomsNew Year's Resolutions: Going the Other WayThe start of a new year is unlike the rest of the year. People call their parents more frequently. The gym gets more crowded. Sales of alcohol, tobacco, and, I’d guess, unhealthy foods go down. Maybe sales of fresh fruit and vegetables go up. These trends are the result of New Year’s resolutions. But they don’t last. After a few days or weeks, people start lighting up, hitting the bottle, eating fast food, not calling mom, and sleeping in rather than going to the gym, just like they always did. New Year’s resolutions fail, because change is hard. Patterns and habits are hard to break. Sometimes, though, against the odds resolutions work out. We really do drop weight, work harder, get along better. But that’s the exception, not the rule. There’s an analogy in baseball, I suppose. Players sometimes try to change. Maybe not as much as fans wish that they’d change. After all, Miguel Sano batted .398 when he didn’t strike out last year. If he could just cut his strikeouts down by 100 and hit .200 in those at-bats instead, he’d have hit .281 instead of .236! How hard can that be? Like going to a 6:00 am spin class or laying off ice cream, those changes are easier said than done. Patterns and habits are as hard to break for baseball players as the rest of us. One pattern you hear about a lot: Pulling the ball. Per data collected by Baseball Info Solutions, Chris Davis stepped to the plate with shifted infielders 301 times last year. Only nine players (David Ortiz 403, Anthony Rizzo 375, Curtis Granderson 346, Kyle Seager 345, Jay Bruce 328, Freddie Freeman 328, Adrian Gonzalez 325, Brandon Belt 313, and Kole Calhoun 303) were shifted more frequently. And only nine (Granderson 24, Kendrys Morales 21, Ortiz 17, Ryan Howard 16, Victor Martinez, Logan Morrison, and Albert Pujols 15, Brian McCann 13) lost more net base hits to the shift than Davis’ 12. It’s easy to see why Davis was shifted so frequently and why it was so effective. Here’s his spray chart from 2016. The green dots are his ground balls:
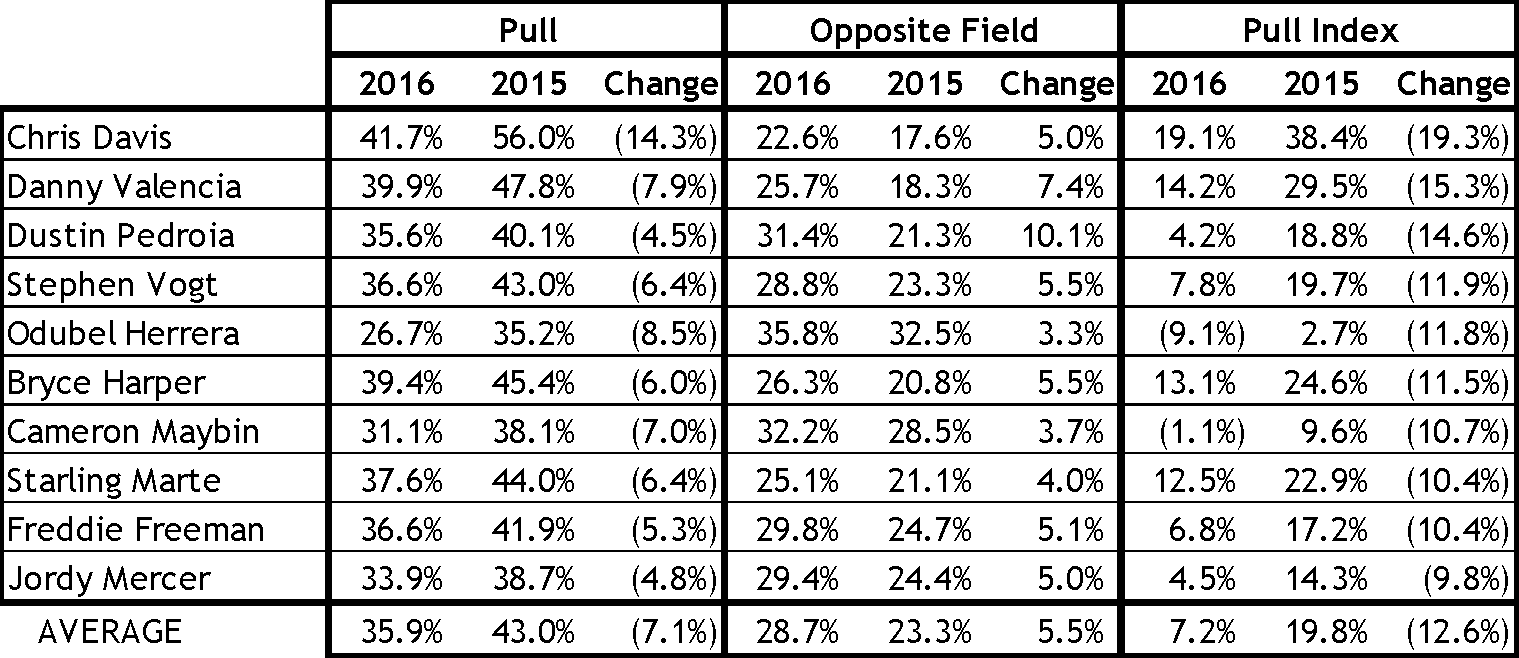
So why, Orioles fans ask, doesn’t Davis do something about it? Why doesn’t he occasionally bunt for a hit or go the other way once in a while? The problem with bunting for a hit is that if the pitcher serves up a meatball, you’d rather see it land 15 rows up in the outfield stands than roll toward the spot where the third baseman would normally be playing. And, like getting more involved with the PTA or giving up chocolate, it’s not easy to change a swing. Our friends at FanGraphs classify each batted ball as pulled, hit to the opposite field, or hit to the center of the field. Using those figures, I calculated a “pull index” of pull percentage minus opposite field percentage. The leader among players with at least 350 plate appearances was Brian Dozier. He pulled 56.4 percent of his batted balls and went the other way on only 15.3 percent for a pull index of 41.1 percent. DJ LeMahieu represented the other extreme, pulling 21.8 percent and hitting 37.9 percent to the opposite field for a pull index of -16.1 percent. Using pull index as a proxy for tendency to hit to one side of the field or the other, I calculated the change from 2015 to 2016. I considered only players with at least 350 plate appearances in each season. That gave me 185 batters, a reasonably good sample. Who changed the most? Who woke up on New Year’s Day a year ago and said to himself, “This is the year I’m going to stop being so pull-happy?”
Orioles fans: He listened! No player changed anywhere near as much as Chris Davis last year in terms of going the other way more frequently. He pulled a lot less frequently and hit to the opposite field more often. He stuck to his resolution! How about players who pulled more?
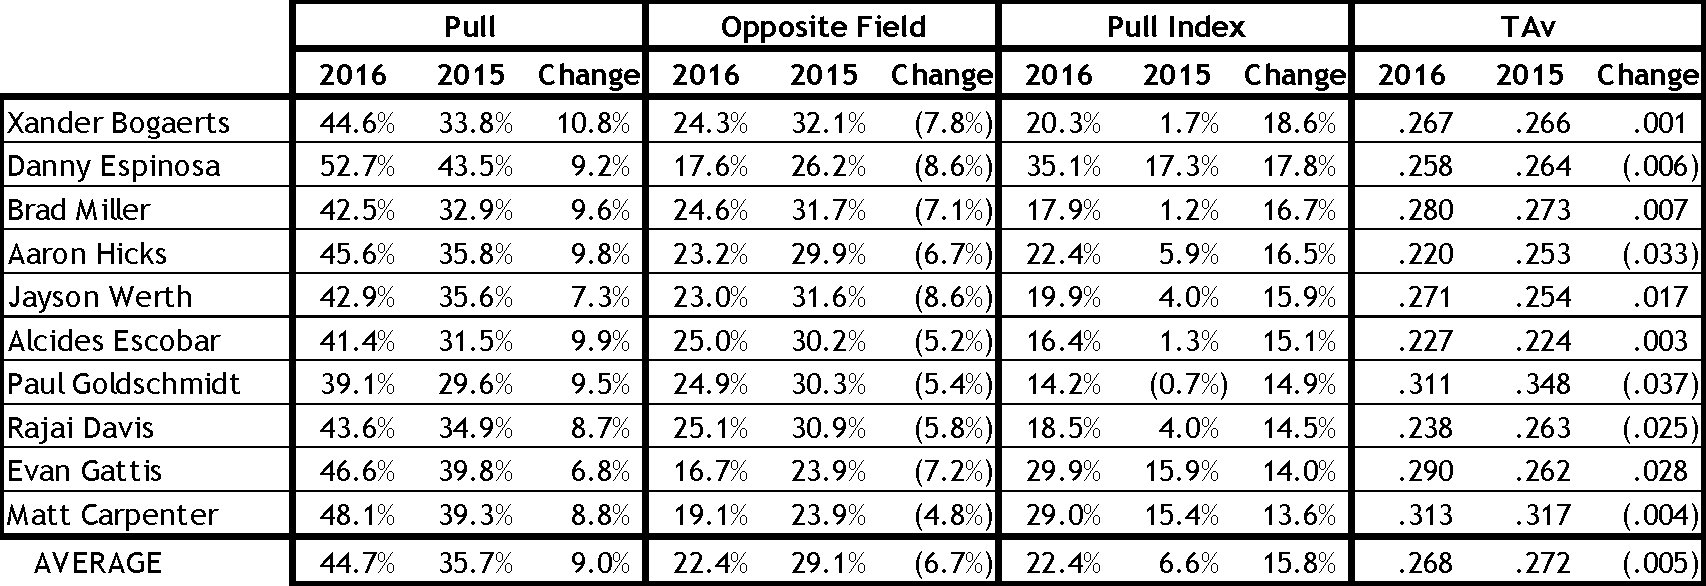
In terms of absolute difference, these players changed where they hit balls more than the players on the first list. It’s also worth noting, I suppose, that six of the 10 players who increased their pull index the most—Xander Bogaerts, Danny Espinosa, Brad Miller, Alcides Escobar, Rajai Davis, and Evan Gattis—set career-highs for home runs last season. The only players on the opposite field table to notch career-highs were Freddie Freeman and Odubel Herrera. That leads to another question: How much of a difference did the change in approach make? I used True Average (TAv), our all-inclusive measure of performance at the plate, scaled to park and league, with a league average of .260:
Well now. That’s not quite what you were expecting, was it? Players who went the opposite way more did slightly worse in 2016 than in 2015. Now, granted, six of the 10 improved, and the overall average swings to positive .003 if you exclude Bryce Harper’s fall from greatness to really goodness. But overall, there really wasn’t much to show for the effort these players presumably made. Maybe pulling more was a good strategy?
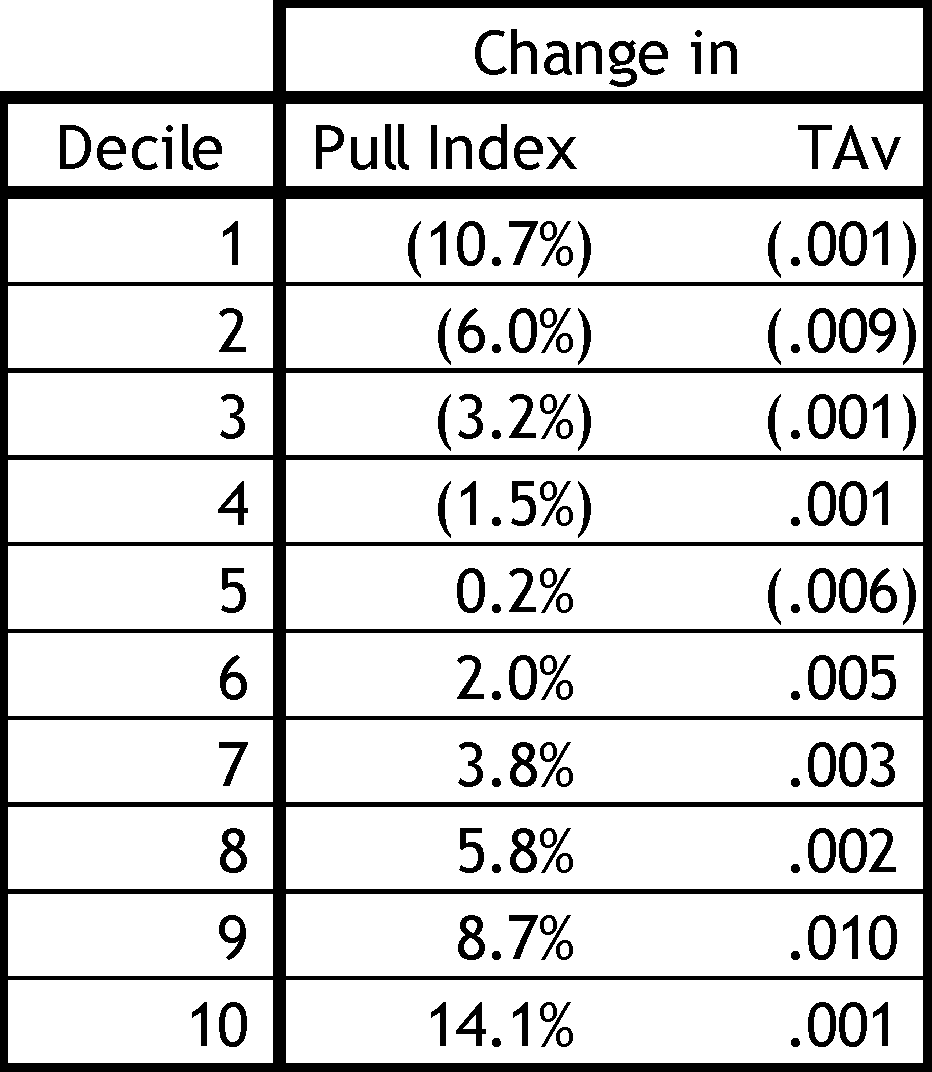
Nope, exactly as with the last table: The 10 players who had the greatest increase in pulled batted balls in 2016, on average, had a TAv five points worse than in 2015. Maybe I’m (inadvertently, I promise) cherry-picking here. As I mentioned, there were 185 players who batted at least 350 times in both 2015 and 2016. Maybe the 10 who comprise these two lists are an underrepresentation. Perhaps players who go the opposite way more, in general, do better, and it’s just that the 10 at the top didn’t happen to. To check that, I divided all 185 players into exactly equally-sized deciles based on their 2016 plate appearances. Here is the weighted average change in pull index and the average change in TAv, per decile. The first decile is the 10 percent of players who went the opposite way the most compared to 2015, and the 10th decile is the 10 percent of players who pulled the most.
There’s something unexpected going on there, and you can see it better in a graph:
See that? The effect isn’t all that strong, but the more often batters went the other way the worse they performed offensively. The results are clustered around no change in the pull index—change is hard!—but there are a couple that stand out. Players in the second decile reduced the pull index by 6.0 percent and suffered a nine-point drop in TAv, on average. That decline goes away if you ignore Mark Teixeira (TAv declined from .313 to .231), Alex Gordon (.299 to .240), Randall Grichuk (.316 to .275), and Matt Duffy (.283 to .252), but of course you can’t really do that, since they comprise about 18 percent of the decile’s plate appearances. Similarly, there was a big (10 points) TAv increase in the ninth decile, in which players net pulled 8.7 percent more frequently, with six players increasing their TAv by 30 or more points (Ichiro Suzuki 48, Angel Pagan 38, Marcell Ozuna 37, Kris Bryant and Chase Utley 33, Yasmany Tomas 30). Overall, the relationship here—players who pulled more in 2016 than in 2015 did better than players who went the opposite way more—isn’t strong. And a chunk of it can probably be explained by age and infirmity, as older/hurt guys can’t catch up to pitches as well, resulting in decreases in both pull index and TAv. (Teixeira and Harper come to mind as victims of age and infirmity, respectively.) But I think we can say that a New Year’s resolution to stop pulling everything and going the other way more—even if a player sticks to it—may not yield the desired results. Players like Chris Davis are like the person who dutifully lays off desserts and is on the treadmill five days a week but doesn’t lose any weight.
Rob Mains is an author of Baseball Prospectus. Follow @Cran_Boy
|
When you look at Chris Davis' spray chart, it's probable that the increase in his opposite field hitting was in the fly ball category only, as the vast majority of his grounders were pulled. I wonder, therefore, if his TAv decline was due to his lesser tendency, purposeful or not, to pull balls a long way in the air. It might be interesting to see how positive changes in pulled fly balls (and, in the same vein, opposite field grounders) from year-to-year correlate with TAv success - I think the relationship might be stronger in a positive direction. Now whether a player can consciously effect change in these parameters by altering his approach is another question...
Using the FanGraphs splits tool, this is the breakdown of percentage of batted balls pulled, hit up the middle, and hit to the opposite field, for Davis (totals don't always add to 100 due to rounding):
FLY BALLS AND LINE DRIVES
2014 38-31-32
2015 46-32-22
2016 32-38-30
GROUND BALLS
2014 77-13-9
2015 79-15-6
2016 60-32-8
So he cut back on air balls to right but cut way, WAY back on grounders to right. That's the lowest percentage of grounders he's pulled in his career.
This Hardball Times article explains why so many grounders are pulled while fly balls often go to the opposite field. The conclusion supports your thesis that a positive change in pulled fly balls is a good thing: http://www.hardballtimes.com/why-flies-go-one-way-and-grounders-go-the-other/
Thanks Rob - I liked your article and the THT reference was great!