CSS Button No Image Css3Menu.com

Baseball Prospectus home
  
  
Click here to log in Click here to subscribe
<< Previous Article
Premium Article Transaction Analysis: ... (01/22)
<< Previous Column
Pitching Backward: Pud... (01/12)
Next Column >>
Premium Article Pitching Backward: Bri... (02/03)
Next Article >>
Premium Article Rubbing Mud: The Remai... (01/22)

January 22, 2016

Pitching Backward

A Refresher on Changeups

by Jeff Long

the archives are now free.

All Baseball Prospectus Premium and Fantasy articles more than a year old are now free as a thank you to the entire Internet for making our work possible.

Not a subscriber? Get exclusive content like this delivered hot to your inbox every weekday. Click here for more information on Baseball Prospectus subscriptions or use the buttons to the right to subscribe and get instant access to the best baseball content on the web.

Subscribe for $4.95 per month
Recurring subscription - cancel anytime.


a 33% savings over the monthly price!

Purchase a $39.95 gift subscription
a 33% savings over the monthly price!

Already a subscriber? Click here and use the blue login bar to log in.

A few years ago, Harry Pavlidis presented some research on what makes a good changeup (part 1, part 2). In the first part of Harry’s analysis, he identified a few key truths about changeups that I’ll include below for quick reference:

1. The faster a pitcher's fastball, the more likely he was to get whiffs with his changeup.

2. The difference in a pitcher's fastball and changeup velocity had a similar relationship.

3. Pitchers with high changeup whiff rates threw the changeup more often.

4. The vertical "drop" of the changeups relative to fastballs impacted the whiff rates that the pitch induced.

I thought that ground-ball rates would be less interesting than whiff rates, and left them out of part one, but the evidence suggests that I was wrong.

1. The mild relationship between fastball speed and changeup whiffs is retained with ground balls.

2. There is a strong relationship between changeup velocity and ground balls—higher-velocity changeups induce more grounders.

3. Changeup speed doesn't impact whiff rate, so this seems like a winning move (but see the caveat in point 5).

4. The smaller the gap between fastball and changeup speed, the more grounders a pitcher induces on changeups.

5. Increasing changeup speed but not fastball speed will hurt whiff rates, a gigantic caveat to point 3.

6. The more sink, the better—no surprise here. Also, the more the changeup sinks relative to the fastball, the greater the ground-ball rates it induces.

Let's put those together:

1. Hey, velocity is good!

2. If you throw a hard changeup (relative to the fastball), you're trading more ground balls for fewer whiffs.

3. Power pitchers (big fastball and a good gap to the changeup) get the best of both worlds (whiffs and grounders).

4. The bigger the drop, the better—sink it, and sink it more than the fastball, and you'll miss bats and get grounders.

What we’ll do now is revisit the second half of Harry’s analysis for 2015 pitchers. Specifically, we’ll look at how we can categorize pitchers across the majors by analyzing their changeups and sorting them into buckets based on a few key attributes.

The first set of charts below presents the raw data in an interactive format. There’s a lot going on, so I’ll attempt to provide a bit of a primer:

Black/Grey/Red points – These are individual pitchers, plotted by GB/BIP (y-axis) and Whiffs/Swing (x-axis). The color of each point represents the average velocity of the changeup for each pitcher, with red being the fastest, and black being the slowest.

Green line – This is a trendline for the data, showing that there’s a very weak but positive correlation between the two axes. This matches, nearly exactly, what Harry found back in 2013.

Axes – These represent the means for each axis. Specifically, 27.8 percent on the Whf/Sw (x-axis) and 50.1 percent on the GB/BIP (y-axis).

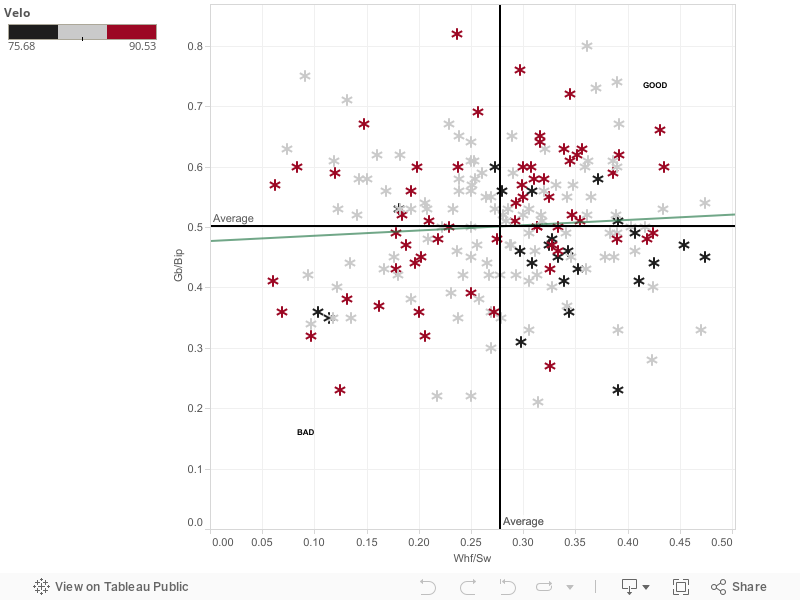
Pitchers in the top right quadrant have some of the best changeups in the game. They get a lot of groundballs, and also a lot of whiffs. Some of them throw their changeups extremely hard while others are middle of the road. It is worth noting, however, that very few soft-tossing pitchers live in this “Good” quadrant. They are:

Pitcher

CH Velocity

GB/BIP

Whf/Sw

David Hale

79.7 mph

51%

39%

Dallas Keuchel

79.9 mph

58%

37%

Kyle Lobstein

79.6 mph

56%

31%

Odrisamer Despaigne

79.3 mph

56%

28%

This likely comes back to Harry’s point that “Hey, velocity is good!” What that table doesn’t necessarily tell us is how each pitcher’s changeup compares to his fastball, a key insight from Harry’s initial investigation. As a result, I’ve duplicated the chart from above, but adjusted the velocity to show the difference between each pitcher’s fastball and his changeup. Pitchers in red have large gaps between the two pitches, while pitchers in black have tighter gaps:

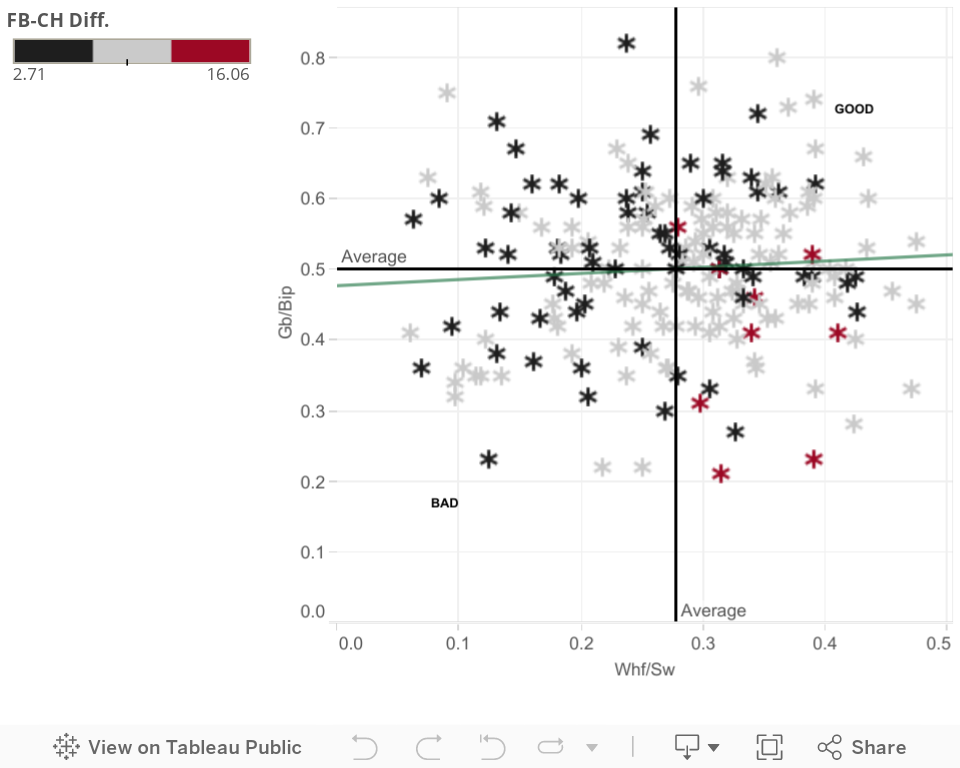
For the most part this is the exact same data, only with the adjusted velocities. Some of Harry’s findings are clear as day when looking at the data through this lens. For example, Harry wrote that pitchers with large gaps in velocity were more likely to generate whiffs. Every red point on the chart is in fact above average in terms of whiffs per swing.

Harry also wrote that the alternative seemed to be consistently true as well. Smaller differences (which are much more common than large ones) tend to produce groundballs at an elevated rate. This one is less clear in the 2015 data, but the majority of the smallest differentials come from pitchers with above-average groundball rates.

So who has the best changeup in baseball based on this data? Any of the following can arguably make that claim depending on your personal preference for groundballs versus strikeouts:

Pitcher

Velocity Diff.

GB/BIP

Whf/Sw

Keyvius Simpson

7.6 mph

80%

36%

Jon Lester

7.5 mph

74%

39%

Carlos Martinez

8.9 mph

66%

43%

Cole Hamels

8.4 mph

54%

47%

Personally? I’m a Cole Hamels kind of guy. Feel free to hover over each player to see where your favorite players land in the landscape of changeups.

***

This, of course, is only part of the story. The profile of these changeups is important as well, though obviously less important than the outcomes they create. Below is another visualization that showcases changeup movement (both horizontal and vertical) as well as velocity differential.

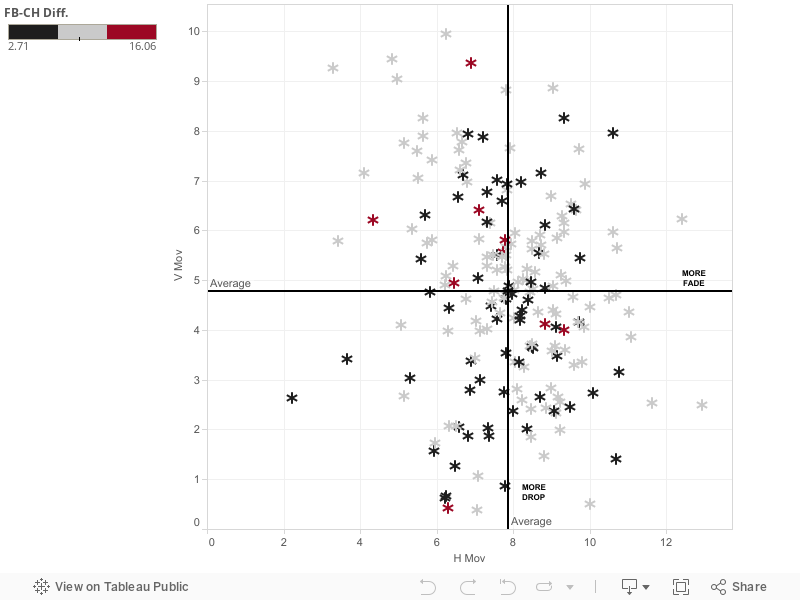
There are a lot of interesting takeaways from this portion of the data. For example, Scott Kazmir has arguably the most extreme changeup in baseball, as it boasts a 16 mph difference off his fastball, above-average "drop," and above-average fade. The profile or description of these changeups is only one piece of the puzzle, but it does help us better understand what opposing hitters are seeing when facing these pitchers.

***

That leaves just one thing left in replicating Harry’s 2013 research: naming names. Below are a few tables that showcase the pitchers who make up the good and bad quadrants of the outcomes effectiveness above. The table includes not only the effectiveness measures used in the chart (GB/BIP, Whf/Sw), but also the profile attributes (velocity differential, movement) highlighted in the previous section.

The “Good” pitchers with above-average groundball and whiff rates:

Pitcher

Velocity

Velo. Diff.

GB/BIP

Whf/Sw

H Mov

V Mov

Aaron Sanchez

90.53

4.80

60%

30.00%

10.09

2.74

Jake Arrieta

89.67

5.28

65%

31.58%

9.48

2.45

Carlos Carrasco

89.06

6.67

63%

33.94%

6.22

0.63

Zack Greinke

88.99

3.49

72%

34.44%

6.58

2.04

Matt Harvey

88.98

7.61

54%

29.31%

8.7

5.91

Jose Fernandez

88.97

7.71

76%

29.69%

9.12

2.33

Michael Pineda

88.91

4.43

61%

34.44%

8.39

4.61

Noah Syndergaard

88.83

8.88

63%

35.63%

8.51

4.83

Felix Hernandez

88.71

4.13

64%

31.63%

6.25

0.66

Luis Severino

88.52

7.38

62%

35.14%

9.26

5.1

Carlos Frias

88.15

7.30

58%

31.03%

7.77

4.64

Yordano Ventura

87.94

9.12

52%

34.66%

6.25

5.09

Carlos Martinez

87.83

8.93

66%

43.08%

9

2.83

Eduardo Rodriguez

87.66

7.20

51%

29.25%

10.5

4.64

Hector Noesi

87.52

6.23

62%

39.22%

9.11

4.06

Michael Wacha

87.45

7.65

57%

29.93%

6.21

4.91

Rubby De La Rosa

87.23

8.30

51%

35.49%

7.83

5.2

Vincent Velasquez

86.96

8.21

58%

32.00%

7.31

4.01

Chris Archer

86.88

9.30

60%

30.77%

7.82

5.5

Jacob deGrom

86.16

9.64

59%

38.57%

7.02

4.17

Corey Kluber

85.81

7.84

60%

43.48%

6.99

3.43

Michael Lorenzen

85.75

8.92

55%

32.50%

7.4

6.15

Matt Garza

85.61

7.90

55%

30.00%

5.64

7.9

Chad Bettis

85.56

7.19

73%

36.94%

5.96

1.72

Roenis Elias

85.39

6.89

52%

28.11%

10.77

3.16

Max Scherzer

85.38

9.41

52%

30.00%

8.81

1.46

Cole Hamels

85.36

8.35

54%

47.41%

9.34

5.97

Jon Lester

85.25

7.53

74%

39.02%

9.11

4.31

Edinson Volquez

85.18

9.48

57%

34.80%

7.07

1.07

Keyvius Sampson

85.16

7.59

80%

36.11%

8.25

5.02

Tom Koehler

85.15

7.69

59%

29.07%

8.03

4.23

Carlos Rodon

85.08

8.90

61%

38.64%

9.18

2.66

Francisco Liriano

85.06

8.26

53%

43.44%

9.03

4.4

Ross Detwiler

84.9

8.05

53%

28.57%

9.15

5.85

Gio Gonzalez

84.56

8.36

67%

39.15%

9.58

3.3

Cody Anderson

84.55

8.68

51%

28.33%

9.7

4.15

CC Sabathia

84.53

6.75

51%

31.85%

7.09

5.04

Kyle Gibson

84.3

8.24

63%

32.05%

8.28

3.25

Mike Fiers

83.76

6.50

65%

28.95%

7.57

5.5

Jaime Garcia

83.75

7.31

60%

35.92%

9.01

3.57

Wade Miley

83.7

8.09

55%

36.51%

9.51

6.53

Severino Gonzalez

83.58

6.38

61%

36.17%

7.34

2.02

Alec Asher

83.49

8.54

56%

32.00%

4.96

9.04

Dillon Gee

83.28

6.58

52%

31.75%

9.07

2.38

Chris Heston

83.04

7.19

57%

33.12%

8.46

1.84

Chase Whitley

82.62

7.33

55%

34.21%

8.47

2.41

Tommy Milone

81.93

6.54

53%

30.58%

9.74

5.45

Erasmo Ramirez

81.77

10.44

60%

39.03%

8.05

3.35

Jeff Locke

81.59

10.52

52%

36.15%

5.88

5.8

Clay Buchholz

80.72

12.58

52%

38.92%

6.46

4.94

Dallas Keuchel

79.92

10.59

58%

37.13%

8.81

5.53

David Hale

79.67

11.37

51%

39.09%

5.15

2.67

Kyle Lobstein

79.64

7.59

56%

30.86%

7.72

5.46

Odrisamer Despaigne

78.28

13.48

56%

27.94%

4.35

6.2

The “Bad” pitchers with below-average groundball and whiff rates:

Pitcher

Velocity

Velo. Diff.

GB/BIP

Whf/Sw

H Mov

V Mov

Tyler Matzek

89.72

2.71

23%

12.50%

9.34

8.26

Jose Urena

88.25

6.02

39%

25.00%

6.57

6.68

Joe Ross

87.39

6.34

38%

13.16%

8.82

6.11

Matt Wisler

87.29

6.77

37%

16.18%

8.23

4.41

Shelby Miller

87.22

7.83

43%

17.86%

7.78

4.72

Ivan Nova

87.13

6.62

50%

22.86%

8.82

4.84

Anthony DeSclafani

86.76

6.95

36%

20.00%

8.49

3.66

Andrew Cashner

86.74

9.48

36%

27.16%

7.32

5.46

Bud Norris

86.61

8.16

41%

6.06%

6.58

7.61

Alex Colome

86.18

8.89

48%

21.88%

4.1

7.16

Derek Holland

86.16

8.16

32%

9.68%

7.8

8.82

Lance Lynn

86.05

7.12

36%

6.90%

7.13

2.99

Yovani Gallardo

85.94

5.65

47%

18.75%

7.57

7.02

Trevor Bauer

85.86

7.92

48%

27.50%

6.77

4.62

J.A. Happ

85.78

7.04

32%

20.59%

9.58

6.42

Matt Cain

85.78

6.16

49%

17.86%

7.36

1.87

C.J. Wilson

85.72

5.45

45%

20.26%

7.7

6.6

Jeremy Guthrie

85.67

6.82

44%

19.61%

5.7

6.3

Danny Duffy

85.56

8.68

38%

25.74%

9.04

8.87

Ervin Santana

85.5

7.66

42%

24.27%

5.36

6.03

Jarred Cosart

85.48

9.44

22%

21.74%

5.16

7.75

Jonathan Gray

85.32

9.29

38%

19.30%

5.52

7.05

Matt Andriese

85.26

7.08

43%

16.67%

2.21

2.64

Chad Billingsley

85.24

6.90

42%

9.38%

8.16

3.36

Justin Verlander

84.96

8.61

39%

23.08%

9.27

6.29

Robbie Ray

84.93

9.35

35%

11.76%

6.53

7.96

Adam Warren

84.87

8.45

47%

25.60%

8.49

3.72

Aaron Harang

84.79

5.50

44%

13.42%

7.31

6.17

Allen Webster

84.75

7.78

42%

27.78%

7.11

5.83

Jerad Eickhoff

84.72

6.82

30%

26.92%

6.81

7.93

Ryan Vogelsong

84.35

7.88

40%

12.16%

7.94

5.72

Patrick Corbin

84.32

8.62

35%

13.51%

8.35

5.01

Wily Peralta

84.07

11.09

50%

25.00%

5.88

7.42

Steven Matz

84.07

10.94

45%

25.00%

10.02

4.46

Adam Conley

84.05

7.81

44%

26.53%

12.4

6.22

Chris Tillman

83.7

9.03

48%

20.90%

5.48

7.6

Tyler Lyons

83.61

7.40

42%

26.76%

8.35

5.22

David Phelps

83.49

7.90

34%

9.68%

9.85

4.05

Hector Santiago

83.47

7.45

36%

26.94%

10.6

5.96

Jake Peavy

83.35

7.61

50%

22.22%

9.09

3.67

Julio Teheran

83.31

9.00

42%

18.05%

7.45

4.56

Rick Porcello

82.91

9.81

35%

23.75%

7.58

5.2

Chris Rusin

81.93

8.26

46%

23.65%

7.14

3.98

Bartolo Colon

81.89

9.13

45%

17.65%

7.48

5.5

Travis Wood

80.71

9.67

22%

25.00%

9.63

6.41

Randy Wolf

78.51

11.07

36%

10.34%

8.5

5.62

Sean Nolin

77.39

11.11

35%

11.36%

6.77

7.36

Finally, I’ll add roughly the same disclaimer Harry used when he first presented this same data for pitchers in 2013: "Bad" is a relative term, as all of these guys are major leaguers. Furthermore, what's not even considered is how a changeup may set up something else (pitching backward) or whether some pitchers’ shaky changeups are even relevant.

Special thanks to Harry Pavlidis for his support in putting this together.

Jeff Long is an author of Baseball Prospectus. 
Click here to see Jeff's other articles. You can contact Jeff by clicking here

Related Content:  Texas Rangers,  PITCHf/x

3 comments have been left for this article.

<< Previous Article
Premium Article Transaction Analysis: ... (01/22)
<< Previous Column
Pitching Backward: Pud... (01/12)
Next Column >>
Premium Article Pitching Backward: Bri... (02/03)
Next Article >>
Premium Article Rubbing Mud: The Remai... (01/22)

RECENTLY AT BASEBALL PROSPECTUS
Playoff Prospectus: Come Undone
BP En Espanol: Previa de la NLCS: Cubs vs. D...
Playoff Prospectus: How Did This Team Get Ma...
Playoff Prospectus: Too Slow, Too Late
Premium Article Playoff Prospectus: PECOTA Odds and ALCS Gam...
Premium Article Playoff Prospectus: PECOTA Odds and NLCS Gam...
Playoff Prospectus: NLCS Preview: Cubs vs. D...

MORE FROM JANUARY 22, 2016
Internet Baseball Awards: The Jokester-Free ...
Premium Article Rubbing Mud: The Remaining Free Agents and t...
Premium Article Transaction Analysis: Arrows Pointing West
Fantasy Article Tale of the Tape, Dynasty Edition: Bobby Bra...
Fantasy Article Fantasy Players to Avoid: First Base
Fantasy Article The -Only League Landscape: American League ...
Fantasy Article TTO Scoresheet Podcast: Episode 72: First Ba...

MORE BY JEFF LONG
2016-03-08 - Premium Article Pitching Backward: Starting Pitching Depth, ...
2016-02-25 - Pitching Backward: The Superest Utility
2016-02-03 - Premium Article Pitching Backward: Bringing the Heat
2016-01-22 - Premium Article Pitching Backward: A Refresher on Changeups
2016-01-13 - Tools of the Trade
2016-01-12 - Pitching Backward: Pudge, Preserved
2015-12-17 - Premium Article Pitching Backward: The Rise of the LiRPA
More...

MORE PITCHING BACKWARD
2016-03-08 - Premium Article Pitching Backward: Starting Pitching Depth, ...
2016-02-25 - Pitching Backward: The Superest Utility
2016-02-03 - Premium Article Pitching Backward: Bringing the Heat
2016-01-22 - Premium Article Pitching Backward: A Refresher on Changeups
2016-01-12 - Pitching Backward: Pudge, Preserved
2015-12-17 - Premium Article Pitching Backward: The Rise of the LiRPA
2015-12-10 - Premium Article Pitching Backward: The Real-Life Closer Repo...
More...