


 13 comments have been left for this article.
 BP Comment Quick Links

|

|
April 1, 2015 Rubbing MudThe Demise of the Two-Out Rally
The most important big-picture trend in baseball right now is that offense is down (down, down, down). It’s a boring story, though. You know that offense is down. You know, for instance, that strikeouts occurred at the highest rate ever in 2014. You’ve probably heard that power is down, with the league posting its lowest Isolated Power since 1992 last year. If you’ve read any of my recent work around here, you probably know that walks are at their lowest rate since 1968. If you read me even before I started here, you probably know that, curiously, only BABIP is surviving the league-wide extinction event consuming all other kinds of offensive output. Even reciting these facts rapid-fire is boring to you. You want more information, more detail, more dimension. Well, here’s something in that vein. See, a couple of weeks ago, I was re-reading The Book, that holiest of sabermetric do-it-yourself manuals, when I came to the page with the Run Expectancy table for all base-out states, drawn from the years 1999-2002. Here it is now! Run Expectancy By Base-Out State, 1999-2002
In a league where, generally, each team scored nearly five runs per game, these are the number of runs they could expect to score from each state through the end of that inning. Though they’re only a jumble of numbers, really, they made me laugh (a rueful little laugh), because I realized right away how quaint those figures are now. Whereas offense was at an historic apex during the years covered by this chart, it’s now at something of a nadir. Wondering just how different things are now, I looked up the table for 2014 in the BP stat reports. Here it is: Run Expectancy By Base-Out State, 2014
Just compare a few boxes; it’s immediately clear that a radical change took place. To make the changes easier to eyeball, here’s a third chart, this one showing the percentage of the 1999-2002 RE represented by the 2014 RE for each base-out state. Run Expectancy Changes by Base-Out State
Well, now. This chart is where things get interesting. Though the RE of every situation is lower than it was 10-15 years ago, the sagging isn’t uniform across the spectrum of possible situations. Expected runs are down by markedly more when there are no runners in scoring position, and when there are two outs, than at other times. In essence, the worse the odds of scoring were in the first place, the more they have plunged as offense has fallen. Naturally, having an enigmatic statistical finding with which to deal, I emailed Russell Carleton to see what he made of it. Russell’s response: This isn't very surprising. It tells us that since outs are more common than they once were … when we get to a point where we only need one more out to end the inning, it's easier to get. And the situations where runners are closer to home plate have more variance in them. An out in a situation with a runner on third and two out destroys the chance of a run. A non-out has a pretty good chance of driving him in (except a walk or HBP). That accorded with my instincts about this phenomenon. With OBP down so significantly, chaining together positive events the way a team must in order to score runs with two outs is much, much more difficult than it once was. I was inclined, especially after hearing from Russell, to treat this as a fairly natural, minimally interesting finding. It runs a little bit deeper, though. See, as it turns out, 2014 saw two-out offensive performance slide to its worst since 1976, and to its worst ever, relative to offensive performance with zero or one out. (We have this split data as far back as 1960, but only have consecutive seasons of it since 1974.) Overall and Two-Out OPS, 1974-2014
Maybe you can easily see the steepness of the downturn the last two years, but in case it should appear to you that the lines are moving totally in lockstep, here’s two-out OPS as a percentage of the league’s overall OPS over the same span.
What we’re seeing, then, isn’t two-out scoring opportunities declining as the natural outgrowth of a lower overall scoring environment. It’s probably partially that, but it’s also a product of a historic offensive shortfall when there are two outs. That’s fascinating, but very difficult to explain. To attempt to do so, though, we have to start by understanding what makes a two-out plate appearance different from one that comes with zero or one out. So what makes two-out situations special? How do they work? Well, first of all, a two-out plate appearance is always going to have a lower expected OPS than one earlier in an inning. Some portion of fly balls hit with no outs or one get washed away from half of the OPS equation, because they don't count against slugging percentage. That’s why, in the chart above, we can see that two-out OPS has always come in lower than overall OPS. More significantly to this discussion, though, there are different incentives for all the players involved in these plate appearances, too. Because the end of the inning is one well-handled batter away, pitchers are less willing to give in and groove pitchers. For that reason, walk rates rise in two-out spots.
This actually begins to explain our recent phenomenon; note the way two-out walk rates have sagged since 2012, while rates earlier in innings have held much more steady. Now, pitchers will take any kind of out when they have two in hand, but because batters have more incentive to trade contact for power, strikeout rates also rise when there are two away.
Another small piece of the puzzle fits into place: Strikeout rate did spike with two outs last season, relative to at other times during innings, however small the gap. Hitters trade contact for power, while pitchers nibble at the edges of the zone to avoid letting too much of that power be actualized. So who wins that tug-of-war? Do batters find more power with two outs?
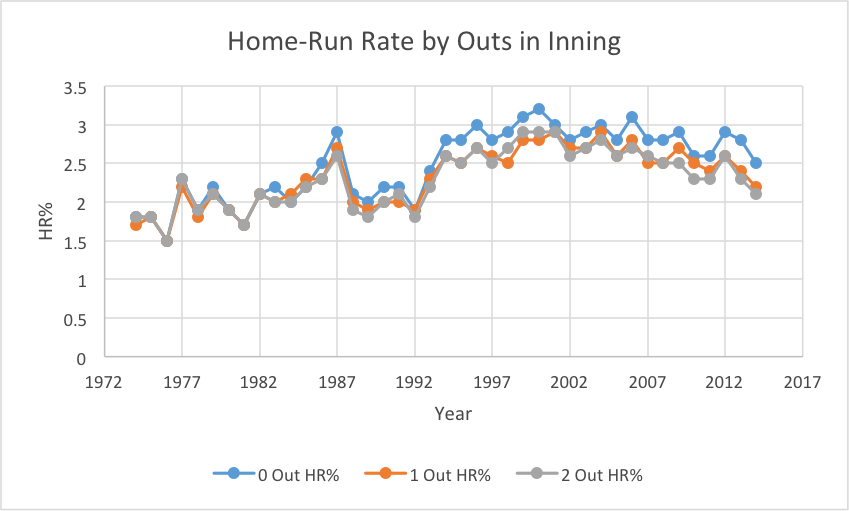
No. Power drops with two outs, though the degree to which that’s true has varied over time. While two-out ISO has plummeted over the last few years, so has zero-out ISO. Nothing much here. What about home runs, specifically? After all, pitchers are taking special care not to make two-out mistakes, handing out more free passes if that’s what they need to do. Are they successful in avoiding homers with that strategy?
Surprisingly, no, not really. There have been times—it was true less than 10 years ago, even—when home runs were more likely with two outs than with one. Two-out homer rates have fallen a little faster than zero- or one-out rates since 2012, but the difference is minute. Finally, fielders can treat two-out situations differently, too. I suspect we saw the first glimpse of two-out fielding’s impact in the ISO chart: The no-doubles defense, or simply a risk-averse mentality, probably results in fewer balls making it into the gaps with two down. In general, though, defenses can play more optimally when there are two outs. Shifts are easier to implement. Defenders don’t need to adjust their positioning to set up double-play actions or to be ready to cut down a runner at the plate. Thus:
There, then, is the shape of two-out offense. More opportunities to get on base present themselves, but those opportunities have less value. Power becomes a premium commodity (the authors of The Book noted this in the context of the batting order; one reason to bat a power-over-OBP guy third is to maximize the leverage of the damage he does, since he’ll often come up with two outs), but is harder to access. Balls in play end in heartbreak. The three true outcomes ($1, Christina Kahrl) take over the game. Which factors have most driven down overall two-out offense, relative to the league’s total production? Two-Out OBP and SLG, Relative to Overall OBP and SLG, 1974-2014
It’s not a single factor; it’s everything. Batters just can’t hit with two outs right now, and it can’t be blamed solely on the offensive environment. Two more questions need to be answered, then: How can batters do better with two down? And how can teams use this information? To answer the first one, let’s do a case study of two hitters whose situational results last season could hardly be more disparate. At one end of the spectrum: Mike Trout. But this isn’t the end of the spectrum you think! Trout was actually terrible with two outs last season: Mike Trout, Offense by Outs in Inning, 2014
On the other hand, Christian Yelich hit five of his nine bombs with two outs. Christian Yelich, Offense by Outs in Inning, 2014
These are small samples of plate appearances, affected heavily by BABIP fluctuations and random variation. Still, Yelich’s drastic differential in power output—no one in the league delivered a bigger ISO boost in two-out situations than the Marlins’ new $50 million man—demonstrates a modular approach, some mechanical and mental adjustments he can make to suit the situation in which he finds himself. Trout is a master adjuster; it’s a good bet that this will look like a fluke when his career is over. Still, for now, Yelich has figured out something that Trout hasn’t, and indeed, that the rest of the batters in the league haven’t. That ability to change one’s approach, to do drastically different things with the ball based on situation, is an extraordinarily rare one in the modern game, and it might just be the key to restoring smoother, more consistent production, especially with two outs. Teams could use all the information above to better educate their hitters on what to expect with two outs, and just as importantly, what they should most strive to do in those spots. They could also, as I alluded to above, play with the batting order, given what we know about the current environment for two-out run production. The median team OBP from the top spot in the batting order last season was .321. The median for the second slot was .329. Given those numbers, the third hitter in the batting order will come to bat with two outs and no one on base in the first inning 45.5 percent of the time. From 1999-2002, this number was 43.7 percent. That’s three extra games a season in which the third hitter is coming up with a run expectancy of .086. The Book found that the first, second, fourth and fifth hitters in the order should be better than the third. That’s even truer now. Every team has a batter (or two, or three, or four) who can’t do anything but hit for power. They strike out a ton, they never walk and they hit for a middling or poor average, but they mash extra-base hits. On most teams, this batter gets shoved down to the sixth or seventh slot in the order. I’m not sure, though, that they shouldn’t be batting third. That third hitter is going to see about as many base runners as anyone; their power won’t be wasted. Their outs just won’t hurt as much as they might in other places in the order. Flawed though they all are, Javier Baez, Pedro Alvarez and Oswaldo Arcia all have strong arguments for being the best third hitters their teams have. Certainly, given the way things shake out now, batting one’s best hitter third—a practice the authors of The Book counseled teams against, but which is still fairly ubiquitous—is an even more criminal waste than it once was. Two-out at-bats are baseball’s third-down plays. They can provide tension and excitement, even in the midst of a game that won’t be decided until the final act. An underrated aspect of the problem with offense being so down lately has been the lack of intrigue in these particular spots. We can’t solve that problem here, and we probably can’t solve it overnight. At least, hopefully, we now understand it—and the discipline of two-out hitting—a bit better.
Matthew Trueblood is an author of Baseball Prospectus. Follow @MATrueblood
|
Slightly off topic, but something that I've wondered for a while: run expectancy tables are often used to argue against certain managerial decisions (like bunting, for example), but since they are based on historical data that includes sub-optimal managerial decisions (which are at times ingrained in the accepted strategies of baseball), isn't the data flawed for that purpose? So when we say that bunting with no outs and a man on first is sub-optimal because the run expectancy is higher with no outs and a man on first than it is with one out and a man on second, the data for run expectancy in these situations is already inclusive of results that are the consequences of that very sub-optimal decision making.
So, while in that particular case we have to presume that the gap would be even wider if the historical data was only gathered using optimal decision making (and therefore the point about bunting in that situation still stands), it makes me wonder generally about the legitimacy of using the runs expectancy data. If certain sub-optimal strategies have been traditionally employed, isn't the whole data set flawed for the purpose of determining what *is* optimal decision making?