

 41 comments have been left for this article.
 BP Comment Quick Links

|

|
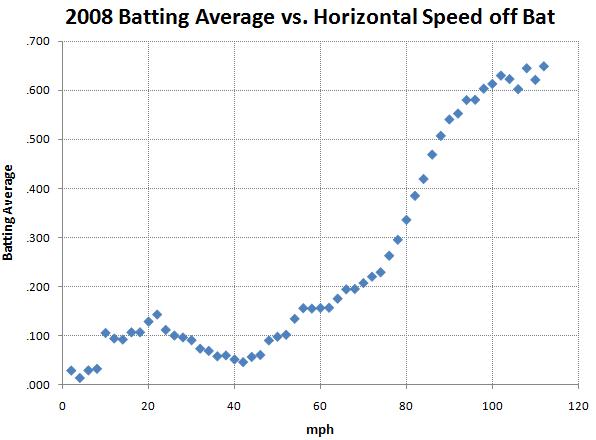
November 16, 2011 Spinning YarnWho Controls How Hard the Ball is Hit?The last decade has seen much discussion and evolution in sabermetric thought around the relative abilities of batters, pitchers, fielders, and Lady Luck to control the outcome of batted balls. Data collected by Sportvision and MLBAM sheds new light on this question, but before we tackle that data, let’s review some of the history of how we came to our current state of knowledge. When Voros McCracken published his Defense-Independent Pitching Statistics in 2001, his findings were considered extremely controversial. Since that time, however, the sabermetric community has largely adopted his conclusions, with some refinements and caveats. McCracken refined his approach a year later and summarized his conclusions as follows: 1. The amount that MLB pitchers differ with regards to allowing hits on balls in the field of play is much less than had been previously assumed. Good pitchers are good pitchers due to their ability to prevent walks and homers and get strikeouts in some sort of combination of those three. 2. The differences that do exist between pitchers in this regard are small enough so that if you completely ignore them, you still get a very good picture of the pitcher’s overall abilities to prevent runs and contribute to winning baseball games. 3. That said, the small differences do appear to be statistically significant if generally not very relevant. The following year, Tom Tippett published an extensive study that modified some of McCracken’s conclusions. Tippett’s summary of his work mostly reflects the current state of knowledge on the topic: 1. Pitchers have more influence over in-play hit rates than McCracken suggested. In fact, some pitchers (like Charlie Hough and Jamie Moyer) owe much of their careers to the ability to excel in this respect. 2. Their influence over in-play hit rates is weaker than their influence over walk and strikeout rates. The most successful pitchers in history have saved only a few hits per season on balls in play, when compared with the league or team average. That seems less impressive than it really is, because the league average is such a high standard. Compared to a replacement-level pitcher, the savings are much greater. 3. The low correlation coefficients for in-play batting average suggest that there's a lot more room for random variation in these outcomes than in the defense-independent outcomes. I believe this follows quite naturally from the physics of the game. When a round bat meets a round ball at upwards of 90 miles per hour, and when that ball has laces and some sort of spin, miniscule differences in the nature of that impact can make the difference between a hit and an out. In other words, there's quite a bit of luck involved. 4. Year-to-year variations in IPAvg-versus-team can occur if the quality of a pitcher's teammates varies from year to year, even if that pitcher's performance is fairly consistent. 5. The fact that there's room for random variation doesn't necessarily mean a pitcher doesn't have any influence over the outcomes. It just means that his year-to-year performances can vary randomly around value other than zero, a value that reflects his skills. 6. Unusually good or bad in-play hit rates aren't likely to be repeated the next year. This has significant implications for projections of future performance. 7. Even if a pitcher has less influence on in-play averages than on walks and strikeouts, that doesn't necessarily mean that in-play outcomes are less important. Nearly three quarters of all plate appearances result in a ball being put in play. Because these plays are much more frequent, small differences in these in-play hit rates can have a bigger impact on scoring than larger differences in walk and strikeout rates. In 2005, John Burnson found that pitchers did not have much impact on their rate of home runs allowed other than the extent to which they allowed outfield flies in general. (Dave Studeman created the xFIP statistic based upon this concept, normalizing not only a pitcher's BABIP rate but also his rate of home runs allowed per outfield fly ball.) In 2005 and 2006, respectively, J.C. Bradbury and David Gassko found that pitchers had no consistency from year to year in their rate of line drives allowed. They confirmed the finding that pitchers had little year-to-year consistency in the rate of home runs allowed on outfield flies, and they also observed some statistically-significant year-to-year correlation in pitchers’ popup rates. Having done this research, it becomes obvious why Voros’ original postulate works so well. While pitchers exhibit great control over the types of balls in play they allow, they show little overall control on the two batted ball types that impact BABIP the most—infield flies (where there is some year-to-year correlation) and line drives (where there is none). More so, as infield flies occur relatively rarely (constituting only slightly more than 4% of all balls in play), they will not have enough of an overall impact for any strong year-to-year relationship in year-to-year BABIP. You can make sense of a pitcher’s season just by looking at his home run, strikeout, and walk rates. But you’ll get a better and more detailed picture by using batted ball data. At this point the devolution of the pitcher’s control over batted balls in sabermetric understanding was basically complete. What mattered on balls in play was whether a pitcher allowed ground balls or fly balls; the rest of his batted-ball performance was unpredictable from year to year. Many analysts thus concluded that strikeouts, walks, and ground ball rate (and perhaps popup rate) were all that mattered for major-league pitchers. In this view, batted ball results beyond getting ground balls (and popups) were due either to the performance of the batter, the pitcher’s fielders and park, or to unrepeatable luck. Other analysts, including this author, believed that the nature of the physics of the game indicated that, though the current statistics did not show it, the pitcher must have significant control not just over the vertical angle at which the ball came off the bat but also over whether the batter’s contact itself was weak or solid. In fact, a conversation to that effect with Tom Tippett at the 2008 Sportvision PITCHf/x Summit has stayed in my mind ever since. I hope that this study will illuminate the question of whether major-league pitchers have a varied and persistent skill in eliciting weak contact. At that same 2008 PITCHf/x Summit, Peter Jensen presented a proposal for measuring the initial speed of batted balls using the PITCHf/x camera footage. Over the following off-season, Sportvision developed the HITf/x system to do just that, and the following summer, Sportvision released the HITf/x data from April 2009 for public study. Earlier this year, I examined the April 2009 HITf/x data to learn whether pitchers had a persistent skill around quality of contact. I found that batters seemed to have a greater degree of control over how hard the ball was hit but that pitchers also had a significant degree of control over batted ball speed. However, the one-month sample size restricted the ability to draw firmer quantitative conclusions, and I did not publish my findings at that time. This summer, Sportvision graciously provided me with the full season of 2008 HITf/x data, allowing me to study the question on a larger sample of just over 124,000 batted balls. The HITf/x data measures the speed and direction of each batted ball throughout its trajectory in the PITCHf/x camera frames, which cover roughly the area between home plate and the pitcher’s mound. The reported speed is the average speed over this distance, which will be slightly lower than the initial speed off the bat due to the drag force. In addition, the speeds of ground balls that bounce very near home plate may be difficult to measure prior to the first bounce. Nonetheless, I believe that the initial speeds reported in the data are accurate and consistent enough for this type of evaluation. To measure the quality of contact, I calculated the initial speed of batted balls in the plane of the playing field. Popups or balls pounded sharply into the ground may leave the bat at a high speed, but they are not usually difficult to field. Balls that travel quickly toward the outfield fence provide a much greater challenge to the fielders. How does the horizontal component of the speed of the ball off the bat relate to the chances that a ball will fall for a hit?
A batted ball with a horizontal speed off the bat (hSOB) of less than 60 mph had only about a 10 percent chance of turning into a hit. These batted balls were typically infield popups or weak ground balls. At horizontal speeds above 50 or 60 mph, the harder the ball was hit, the better the chance the batter reached safely. When the hSOB was 100 mph or more, the chance of getting a hit exceeded 60 percent. We will revisit later how quality of contact and other factors affect batting average on balls in play, but let’s return to the question of who controls the quality of contact. I randomly split the batted balls from the 2008 HITf/x data into two halves and compared the average hSOB between halves for each pitcher and batter with at least 300 total batted balls.
Batters have a good deal of correlation between halves of the sample, with a correlation coefficient of r=0.76 with an average of 201 batted balls in each half. That means that we would add 63 batted balls (or about one month’s worth) at league average to the observed average speed for each batter in order to estimate his true skill. Here are the batters (excluding pitchers) with the highest and lowest average hSOB in 2008, after applying the regression toward the league average:
Pitchers have fairly good correlation between halves of the sample, though not as good as batters. The correlation coefficient is r=0.48 with an average of 251 batted balls in each half. That means that we would add 269 batted balls (or about three months’ worth for a starter) at league average to the observed average speed for each pitcher in order to estimate his true skill. One thing that stands out is that the spread of values among pitchers is not as big as the spread among batters. For players with at least 300 batted balls, the standard deviation in average hSOB for batters was 3.2 mph, and for pitchers it was 1.8 mph. Here are the pitchers with the lowest and highest average hSOB allowed in 2008, after applying the regression toward the league average:
However, the spread (standard deviation) of the batters’ regressed average hSOB of 2.76 mph is wider than the spread of the pitchers’ regressed average hSOB of 1.08 mph. Thus, we can estimate that the batter’s average hSOB has about (2.76*1.20) / (1.83*1.08) = 1.7 times as much influence on the resulting hSOB of the batted ball as does the pitcher’s average hSOB. To put it another way, the pitcher’s average quality of contact is more predictive of the quality of contact on a given batted ball than is the batter’s average quality of contact. However, the average quality of contact varies much less among pitchers than it does among batters in major-league baseball. As a result, the identity of the batter is more important in determining the resulting quality of contact than the identity of the pitcher, at least to the extent that we can determine it with these statistical techniques. I also performed a similar regression comparing the hSOB of the 40,000 batted balls in the sample to the observed average hSOB for the batter and pitcher involved where the batter and pitcher each had at least 300 batted balls. The results are similar. For that sample, the best prediction for the horizontal speed of the ball off the bat comes from weighting the pitcher’s regressed average hSOB by 1.04 and the batter’s regressed average hSOB by 0.99. The spread of the batters’ observed average hSOB of 3.16 mph is wider than the spread of the pitchers’ regressed average hSOB of 1.77 mph. Thus, we can estimate that the batter’s average hSOB has about (3.16*0.99) / (1.04*1.77) = 1.7 times as much influence on the resulting hSOB of the batted ball as does the pitcher’s average hSOB. I tried the same regression using pitcher strikeout rate per plate appearance as an additional independent variable, but it had virtually no additional explanatory power in the model (p-value of 0.47). It is probably possible to build a more sophisticated model to predict batted ball speed based upon batter and pitcher characteristics. However, this simple model suggests that the batter has about twice as much influence on the quality of contact as does the pitcher. A major-league pitcher does not only control whether he gets ground balls or fly balls; he also has a significant degree of control over how hard the ball is hit, though the batter has somewhat more control over the quality of contact than the pitcher. I consider this an extremely significant finding. Given what we know about DIPS and the unreliability of pitcher BABIP, this conclusion may surprise some. However, let me quickly clarify two points. First, I have not excluded home runs from the analysis to this point. Removing home runs was a construct, and an illuminating one, that McCracken chose to make DIPS work. However, if we wish to discuss quality of contact, it would be arbitrary and incorrect to remove many of the hardest-hit balls from the sample. We have access to data that was not available a decade ago; thus, we can look at the quality of contact more directly. This analysis is independent of the fielders by virtue of looking at the batted ball speed rather than by segregating by batted ball outcome. Second, batter and pitcher split-half hSOB correlations are basically unchanged if home runs are excluded from the analysis. It is possible to conduct a similar analysis with an eye toward better understanding BABIP. The causes of batted ball results are complex and interdependent, but in the second part of this study, I will sketch out some preliminary findings on that topic. Thanks to Sportvision and MLBAM for providing the HITf/x data for the study. Thanks to Colin Wyers for his input and feedback. Thanks also to Brian Mills and Dave Studeman for their assistance.
Mike Fast is an author of Baseball Prospectus.
|
Awesome.