 6 comments have been left for this article.
 BP Comment Quick Links

|

|
September 23, 2009 Prospectus Hit and RunThe Underachieving Class of 2009
Last week, I checked in on the Angels' quest to make sabermetric history. Examining their third-order Pythagenpat projection-their Pythagorean record based upon their hits, walks, total bases, stolen bases, and outs of all kinds, as well as those of their opponents, all adjusted for park, league, and quality of competition-I discovered that they were on their way to becoming the first team to finish at least 10 games above their third-order projection for a second year in a row. At the time, the Halos' D3, the difference between their third-order wins and their actual wins as published in our Adjusted Standings report, was 11.5 games, but I noted that suggesting they were "on pace" for an even higher mark was a misnomer, since teams that are outperforming their Pythagorean records by wide margins in either direction tend to regress to the mean. As if on cue, that D3 has shrunk to 10.1 games at this writing. Meanwhile, there's also potential history being made at the other, less happy end of the Pythagorean spectrum. Since 1901, twenty-five teams have finished at least 10 games below their third-order Pythagenpat projection. Only twice have two teams done so within the same year, first time in 1912 (when both the Brooklyn Dodgers and Boston Braves achieved ignominy), and then again in 1993 (when the Mets and Padres did it). This year, no less than four teams are threatening to join those ranks, including two from the same division: Rnk Year Team W-L Pct R RA AEQR AEQRA D3 1 1993 Mets 59-103 .364 672 744 672 736 -15.1 2 1935 Braves 38-115 .248 575 852 593 835 -14.6 3 1986 Pirates 64-98 .395 663 700 666 697 -13.6 4 2009 Nationals 51-99 .340 661 825 664 773 -13.2 5 1946 A's 49-105 .318 529 680 529 662 -12.8 6 1905 Browns 54-99 .353 512 608 521 601 -12.7 7 1937 Reds 56-98 .364 612 706 620 700 -12.4 8 1939 Browns 43-111 .279 733 1035 752 1003 -12.2 9 1962 Mets 40-120 .250 617 948 631 924 -12.1 10 1917 Pirates 51-103 .331 464 595 468 579 -11.9 11t 1975 Astros 64-97 .398 664 711 668 711 -11.8 11t 1984 Pirates 75-87 .463 615 567 612 564 -11.8 13 2001 Rockies 73-89 .451 923 906 910 870 -11.5 14 1993 Padres 61-101 .377 679 772 681 764 -11.4 15 2009 Blue Jays 68-83 .450 727 719 745 714 -11.3 16t 1924 Cardinals 65-89 .422 740 750 745 752 -11.1 16t 1961 Phillies 47-107 .305 584 796 599 782 -11.1 18 1907 Reds 66-87 .431 526 519 527 522 -11.0 19 1967 Orioles 76-85 .472 654 592 657 602 -11.0 20 1936 Phillies 54-100 .351 726 874 739 869 -10.9 21 2006 Indians 78-84 .481 870 782 882 800 -10.7 22t 1912 Dodgers 58-95 .379 651 744 665 742 -10.4 22t 1952 Tigers 50-104 .325 557 738 563 716 -10.4 23 2009 D'backs 66-86 .434 678 735 693 690 -10.3 24 1919 Senators 56-84 .400 533 570 533 565 -10.2 25t 1912 Braves 52-101 .340 693 871 705 857 -10.1 25t 1928 Phillies 43-109 .283 660 957 682 936 -10.1 25t 1972 Giants 69-86 .445 662 649 662 648 -10.1 30t 2009 Rays 77-74 .510 748 691 774 662 -9.6 Recall that the overachievers list skews towards recent history, with the Wild Card era producing eight of the 21 teams who have finished at least 10 games above their expected records. This one, on the other hand, tilts heavily towards the pre-World War II era, producing 12 of the 25 who've finished at least 10 games below their expected records. Not counting this year's bountiful class, just two of the top underachievers are from the Wild Card era. The main reason for that, I suspect, has to do with bullpen usage. As noted last year and again in last week's piece, a strong bullpen is a consistent means of such overachievement; the historical correlation between a team's cumulative WXRL and its D3 is .42, whereas it's just .20 for SNLVAR. It makes some amount of sense that the current era might produce more overachievers and fewer underachievers because of the fact that WXRL rates and Leverage scores have been on the rise historically, as bullpens have assumed a higher percentage of innings and increased specialization has tailored more specific roles than 20 or 30 years ago:
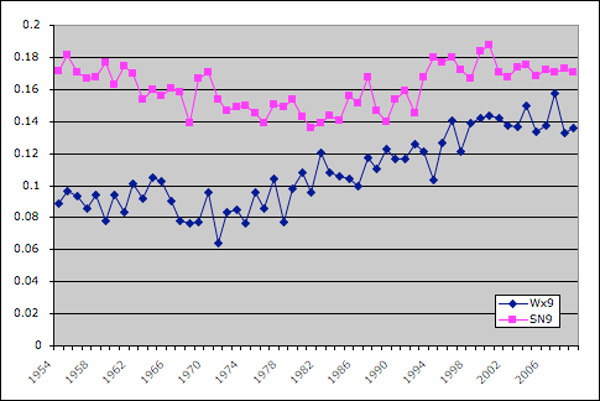 Note that Bruce Sutter's advent as the modern closer marks something of a turning point here. WXRL rates rose above 0.1 per nine innings only four times from 1954 through 1979. By that point, Cubs manager Herman Franks had begun his attempt to limit Sutter's deployment to close games in which the Cubs had a lead-save situations, in other words. The strategy began to take hold, and the only time WXRL rates have been below 0.1 per nine innings since was in the 1981 strike year. They're now about 40 percent higher than they were 30 years ago. Anyway, from the overachiever group, 15 of the 16 teams hailing from the Retrosheet era (1954 onward) finished in the league's top three in WXRL. There's a similar consistency to the underachiever group:
Year   Team       WXRL    Rank
1961   Phillies    1.6    6/8
1962   Mets       -1.1   10/10
1967   Orioles     9.3    2/10
1972   Giants     -1.8   12/12
1975   Astros      0.8   11/12
1984   Pirates     2.8    9/12
1986   Pirates     2.1   11/12
1993   Mets       -3.1   14/14
1993   Padres      5.5   10/14
2001   Rockies     0.1   14/14
2006   Indians    -1.5   13/14
Of the 11 underachievers from the Retrosheet era, eight finished in the bottom three of their league, two others finished with the fourth- and fifth-worst rankings, and then there are the 1967 Orioles, the list's odd ducks. The defending World Champions at the time, they outscored their opponents by a handy 62-run margin via the league's second-best offense according to EqA. Their bullpen ranked second in WXRL, and their third-order projection called for 87 wins. Yet their rotation ranked ninth in SNLVAR in a 10-team league, they were an anemic 33-55 in games decided by one or two runs, and their differential was further distorted by the fact that they went 18-8 in games decided by six or more runs. The four "Class of 2009" underachievers certainly fit the schema, as each of them ranks in the bottom four in their league in WXRL. Taking a closer look at what's gone wrong with their bullpens:
It's also worth noting that offense has played a part in these teams' underachievement as well. The Jays, Diamondbacks, and Nationals have all hit worse than the major league average (in terms of OPS) with runners in scoring position, and in the Close and Late category, while the Snakes, Nats, and Rays are all below average with two outs and runners in scoring position. Exploring the link between Pythagorean over- and underachievement and the hitting end of things remains is something I'm planning to do more fully once the season is over. In the meantime, though the playoff races are more or less sewn up now, between the Angels and these four teams, there's plenty to watch on our Adjusted Standings page.
|
Jay - I argued that the Rays' bullpen was not the cause of the Rays weaker than anticipated record, and you provided data to question my claim (okay, you kind of squashed it.) But in short - the bullpen really was not that terrible - it has been mediocre. It even has had a good month.
Now can you provide the same data to confirm my opinion that the Rays bullpen, in the last few weeks, have been worse than the 2007 Devil Rays bullpen - the mother of all terrible bullpens? Thanks.
Small sample caveats apply, of course, but you could argue they've been about as bad in some ways, and worse in others.
For the month of September, Rays relievers have put up a 6.47 Fair Run Average, which doesn't quite meet the 2007 Devil Rays' record-tying mark of 6.80; this year's Orioles (7.26), Nats (7.39) and Pirates (7.97) have had worse Septembers on that front.
However, you can make a case that on a Win Expectancy level, the current team's bullpen has been much worse. Their -2.2 WXRL this month is the equivalent of -0.4 WXRL per nine innings (the Pirates are the only other team whose WXRL has been lower than -0.6). Those 2007 D-Rays were at -1.6 WXRL for the entire year, or about -0.03 WXRL per nine. The worst full-season mark on that front is the 1973 Braves, who were -0.15 WXRL per nine innings.