 9 comments have been left for this article.
 BP Comment Quick Links

|

|
July 18, 2012 Manufactured RunsGetting Shifty Again
A while back, you may recall, I wrote an article about Brett Lawrie’s rating in one defensive metric, Baseball Info Solution’s Defensive Runs Saved. My conclusion:
Apparently, I’m like E.F. Hutton—when I talk, people listen. Baseball Info Solutions has modified their DRS methodology:
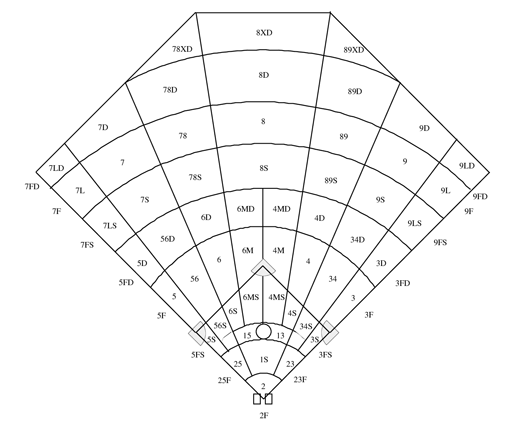
First, let us give credit where credit is due: BIS recognized a problem, and has fessed up to it and attempted to correct it. That’s good. What’s unfortunate is the way they have done so, which will give Lawrie a more palatable fielding rating but will do nothing to address the larger methodological problem that led to Lawrie’s outsized rating and continues to affect BIS’s DRS estimates in less outrageous (but probably far more vital) ways. Let’s go back to what was causing those inflated ratings—the fact that Lawrie was making those plays in an area where the third baseman does not usually make many plays at all, and thus was receiving outsized credit for those plays. But the reason that credit was outsized should be stated explicitly—after all, these were plays that Lawrie was making which presumably helped his team record outs and thus prevent runs and win games. The reason the credit to Lawrie was outsized was because it assumes that if he hadn’t been positioned where he had been, there was almost no chance of a play being made on that ball. From the perspective of the third baseman, that’s true; from the perspective of the team, that’s absurd. Now when you put the third baseman out in short right field, the problems with this approach become readily apparent. But that doesn’t mean that’s the only time these kinds of problems crop up. We can expect to see this methodology causing problems even on a ground ball hit in the hole between third and short. Going back to our Retrosheet field diagram and sample data, let’s look at balls hit in the 56 zone. At the team level, the average play-made rate on a ground ball hit in that zone is 0.51. The average play-made rate for third basemen on ground balls hit in that zone is 0.35. If a ground ball is hit in the 56 zone (or I should say, if the scorer claims such) and gets through the infield for a base hit, the third baseman will be evaluated based on .35 expected outs, and the shortstop will be responsible for .16 expected outs, the way a system like DRS is set up. But if the third baseman fields the ball, he’ll get .35 expected outs—and the shortstop will get zero expected outs, since the third baseman fielded it. That’s .16 expected outs that simply vanish into thin air. So what you end up with, using the methodology outlined by BIS, is a lower quantity of expected outs than actual outs at the league level. Thanks to the extreme example of Lawrie, we know that BIS was not attributing these missing expected outs to the fielder who fielded the ball—otherwise Lawrie would not have had the extreme numbers he had. But since DRS (and rPM, its fielding component) zero out properly at the league level, we know those missing expected outs are being redistributed. What we don’t know is how or why. So why do these missing expected outs matter? Because at the team level, this leads to a distorted evaluation of fielders, if the missing outs are not tracked and then reallocated at the team level. Depending on which player makes the majority of plays in areas of shared fielding responsibility, some teams may have very different distributions of missing expected outs—and if those are not being properly tracked and allocated, that leads to distorted assessments of fielding for both teams and players. As Bill James wrote in the New Bill James Historical Baseball Abstract, “Traditional fielding analysis often fails because the fielding statistics of a good team are not very much different from the fielding statistics of a poor team. This is not true of pitching or hitting. … The effect of this is that traditional fielding analysis, starting with individual fielding statistics, will usually rate a bad team as being better defensively than a good team.” The same logic seems to be applicable to nontraditional fielding analysis that starts with individual fielding statistics as well—by not properly accounting for the missing expected outs, you can end up with distorted ratings of the best defensive teams and players. I used to believe, when I was young and dumb… okay, younger and dumber, that once you had good batted ball data, you didn’t need to do top-down defensive analysis the way Bill James did it in Fielding Win Shares. We still don’t have good batted ball data, of course, but I’m becoming more and more persuaded that if we did, we still would have to adopt the top-down approach, and shared zones of responsibility are a great example of why. How should we handle plays in the 56 zone, assuming our location data is good? First, we should ignore individual fielders and just count how many extra plays happen in that zone. That gives us our baseline. Then we can look at which fielders are making those plays. If the third baseman is making many more plays than expected, but the overall rate of plays in the zone is roughly what we’d expect from the average team, then we have what looks like a ball-hog. If the total rate of plays in that zone is above average, though, we can say with more confidence than the extra plays being made by the third baseman are actually contributing to his team’s fielding. But we have no way of telling the two apart unless we start with the team-level analysis. Throwing out shift plays will get rid of the most extreme examples of the player-first methodology causing problems with defensive ratings, but it doesn’t solve the underlying problem, which is sadly still present in BIS’s DRS. Without more information from BIS, it’s difficult (if not impossible) to determine how those missing expected outs are being distributed. But unless they’re being distributed based on a team-level overview of fielding performance, they’re causing very real distortions in the estimates of fielding performance. And while those distortions affect no one player as much as they did Lawrie, they affect many more players than Toronto’s shifting has.
Colin Wyers is an author of Baseball Prospectus. Follow @cwyers
|
Colin, first of all, your explanation of the distribution of credit in the Plus/Minus system is wrong. What you are describing more closely matches UZR (as I understand it) than Plus/Minus and DRS. Plus/Minus does not have the same problem.
Also the shared zone "problem" is a lot less of a problem when you divide the infield into single degree slices, 90 of them, rather than the 8 (!) in the retrosheet diagram you display here. Also, splitting each into six velocity/timer buckets, as BIS does, helps to further segregate plays.
Ben, I'm going off what's in the most recent version of the Fielding Bible. If you can provide a more detailed description of your methodology, I think that would be helpful to everyone.
As for the impact of smaller zones on the shared zone problem, you'll have fewer shared zones that way, yes, but you'll still have them. The Retrosheet numbers were merely to help illustrate the point.