| Player | Player Sort | Pos | Salary | Salary Sort | Pct | Pct Sort | WARP | WARP Sort | WARP/$M | WARP/$M Sort | $/WARP | $/WARP Sort | Current Status |
|---|
 Jayson Werth
 |
Werth Jayson |
RF |
$20,571,429 |
20571429 |
14.98% |
14.98 |
4.82 |
4.81536 |
0.23 |
0.23407999512333 |
$4,272,044 |
4272043.8347289 |
|
 Ryan Zimmerman
 |
Zimmerman Ryan |
LF |
$14,000,000 |
14000000 |
10.19% |
10.19 |
1.10 |
1.09714 |
0.08 |
0.078367142857143 |
$12,760,450 |
12760449.897005 |
|
 Rafael Soriano
 |
Soriano Rafael |
RP |
$14,000,000 |
14000000 |
10.19% |
10.19 |
-0.02 |
-0.0224962 |
— |
0 |
— |
0 |
|
 Adam LaRoche
 |
LaRoche Adam |
1B |
$12,000,000 |
12000000 |
8.74% |
8.74 |
3.43 |
3.43475 |
0.29 |
0.28622916666667 |
$3,493,704 |
3493704.0541524 |
|
 Gio González
 |
Gonzalez Gio |
RP |
$8,600,000 |
8600000 |
6.26% |
6.26 |
3.18 |
3.18352 |
0.37 |
0.37017674418605 |
$2,701,412 |
2701412.273207 |
|
 Jordan Zimmermann
 |
Zimmermann Jordan |
RP |
$7,500,000 |
7500000 |
5.46% |
5.46 |
5.07 |
5.06995 |
0.68 |
0.67599333333333 |
$1,479,305 |
1479304.5296305 |
|
 Doug Fister
 |
Fister Doug |
RP |
$7,200,000 |
7200000 |
5.24% |
5.24 |
2.51 |
2.51308 |
0.35 |
0.34903888888889 |
$2,865,010 |
2865010.2662868 |
|
 Ian Desmond
 |
Desmond Ian |
SS |
$6,500,000 |
6500000 |
4.73% |
4.73 |
4.14 |
4.14187 |
0.64 |
0.63721076923077 |
$1,569,339 |
1569339.4529524 |
|
 Denard Span
 |
Span Denard |
CF |
$6,500,000 |
6500000 |
4.73% |
4.73 |
5.43 |
5.43056 |
0.84 |
0.83547076923077 |
$1,196,930 |
1196929.9667069 |
|
 Tyler Clippard
 |
Clippard Tyler |
RP |
$5,875,000 |
5875000 |
4.28% |
4.28 |
1.59 |
1.59231 |
0.27 |
0.2710314893617 |
$3,689,608 |
3689608.1793118 |
|
 Nate McLouth
 |
McLouth Nate |
PH |
$5,000,000 |
5000000 |
3.64% |
3.64 |
-0.57 |
-0.567211 |
— |
0 |
— |
0 |
|
 Stephen Strasburg
 |
Strasburg Stephen |
RP |
$3,975,000 |
3975000 |
2.89% |
2.89 |
7.25 |
7.25425 |
1.82 |
1.8249685534591 |
$547,955 |
547954.64727573 |
|
 Drew Storen
 |
Storen Drew |
RP |
$3,450,000 |
3450000 |
2.51% |
2.51 |
1.17 |
1.1711 |
0.34 |
0.33944927536232 |
$2,945,948 |
2945948.2537785 |
|
 Ross Detwiler
 |
Detwiler Ross |
RP |
$3,000,000 |
3000000 |
2.18% |
2.18 |
-0.53 |
-0.529498 |
— |
0 |
— |
0 |
|
 Anthony Rendon
 |
Rendon Anthony |
3B |
$2,700,000 |
2700000 |
1.97% |
1.97 |
5.25 |
5.24901 |
1.94 |
1.9440777777778 |
$514,383 |
514382.71216858 |
|
 Scott Hairston
 |
Hairston Scott |
PH |
$2,500,000 |
2500000 |
1.82% |
1.82 |
-0.34 |
-0.341306 |
— |
0 |
— |
0 |
|
 Bryce Harper
 |
Harper Bryce |
LF |
$2,150,000 |
2150000 |
1.57% |
1.57 |
1.82 |
1.82471 |
0.85 |
0.8487023255814 |
$1,178,269 |
1178269.4236344 |
|
 Wilson Ramos
 |
Ramos Wilson |
C |
$2,095,000 |
2095000 |
1.53% |
1.53 |
1.50 |
1.50079 |
0.72 |
0.71636754176611 |
$1,395,931 |
1395931.4760893 |
|
 Jerry Blevins
 |
Blevins Jerry |
RP |
$1,675,000 |
1675000 |
1.22% |
1.22 |
1.48 |
1.47849 |
0.88 |
0.88268059701493 |
$1,132,913 |
1132912.6338359 |
|
 Craig Stammen
 |
Stammen Craig |
RP |
$1,375,000 |
1375000 |
1.00% |
1.00 |
1.03 |
1.02549 |
0.75 |
0.74581090909091 |
$1,340,822 |
1340822.4361037 |
|
 Ross Ohlendorf
 |
Ohlendorf Ross |
DNP |
$1,250,000 |
1250000 |
0.91% |
0.91 |
— |
0.00 |
— |
0 |
— |
0 |
|
 Matt Purke
 |
Purke Matt |
DNP |
$1,037,500 |
1037500 |
0.76% |
0.76 |
— |
0.00 |
— |
0 |
— |
0 |
|
 Jose Lobaton
 |
Lobaton Jose |
C |
$950,000 |
950000 |
0.69% |
0.69 |
0.81 |
0.80882 |
0.85 |
0.85138947368421 |
$1,174,551 |
1174550.5798571 |
|
 Kevin Frandsen
 |
Frandsen Kevin |
PH |
$900,000 |
900000 |
0.66% |
0.66 |
-0.44 |
-0.438174 |
— |
0 |
— |
0 |
|
 Danny Espinosa
 |
Espinosa Danny |
2B |
$540,850 |
540850 |
0.39% |
0.39 |
-0.23 |
-0.234046 |
— |
0 |
— |
0 |
|
 Tanner Roark
 |
Roark Tanner |
RP |
$506,100 |
506100 |
0.37% |
0.37 |
3.52 |
3.51622 |
6.95 |
6.9476783244418 |
$143,933 |
143932.9734772 |
|
 Taylor Jordan
 |
Jordan Taylor |
RP |
$504,300 |
504300 |
0.37% |
0.37 |
0.33 |
0.328363 |
0.65 |
0.65112631370216 |
$1,535,800 |
1535800.3185499 |
|
 Erik Davis
 |
Davis Erik |
DNP |
$501,400 |
501400 |
0.37% |
0.37 |
— |
0.00 |
— |
0 |
— |
0 |
|
 Aaron Barrett
 |
Barrett Aaron |
RP |
$500,000 |
500000 |
0.36% |
0.36 |
0.72 |
0.719593 |
1.44 |
1.439186 |
$694,837 |
694837.22048436 |
|
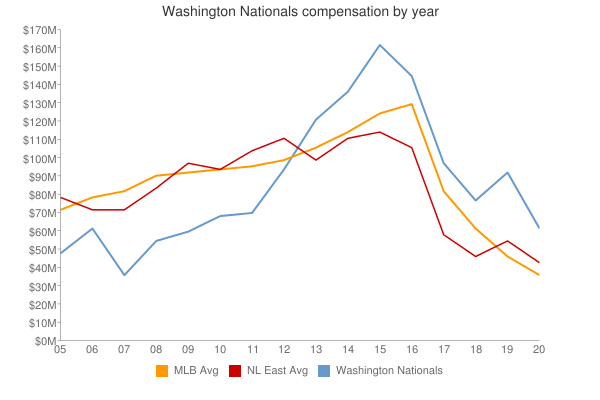
| Year | Nationals payroll |
PR Sort |
Avg payroll |
AvgPR Sort |
Diff |
Diff Sort |
|---|
| 2005 | $48,613,000 | 48613000 | $73,628,169 | 73628169 | $-25,015,169 | -25015169 |
| 2006 | $62,520,000 | 62520000 | $81,192,832 | 81192832 | $-18,672,832 | -18672832 |
| 2007 | $37,347,500 | 37347500 | $85,747,487 | 85747487 | $-48,399,987 | -48399987 |
| 2008 | $56,261,000 | 56261000 | $93,079,041 | 93079041 | $-36,818,041 | -36818041 |
| 2009 | $59,878,000 | 59878000 | $92,957,049 | 92957049 | $-33,079,049 | -33079049 |
| 2010 | $65,275,000 | 65275000 | $94,957,956 | 94957956 | $-29,682,956 | -29682956 |
| 2011 | $70,794,429 | 70794429 | $97,426,414 | 97426414 | $-26,631,985 | -26631985 |
| 2012 | $92,534,929 | 92534929 | $100,689,500 | 100689500 | $-8,154,571 | -8154571 |
| 2013 | $121,289,679 | 121289679 | $106,658,387 | 106658387 | $14,631,292 | 14631292 |
| 2014 | $137,356,579 | 137356579 | $115,428,670 | 115428670 | $21,927,909 | 21927909 |
| 2015 | $162,014,559 | 162014559 | $125,458,486 | 125458486 | $36,556,073 | 36556073 |
| 2016 | $145,178,886 | 145178886 | $130,290,910 | 130290910 | $14,887,976 | 14887976 |
| 2017 | $164,335,444 | 164335444 | $136,573,000 | 136573000 | $27,762,444 | 27762444 |
| 2018 | $180,849,056 | 180849056 | $135,681,867 | 135681867 | $45,167,189 | 45167189 |
| 2019 | $197,203,691 | 197203691 | $134,776,225 | 134776225 | $62,427,466 | 62427466 |
| 2020 | $173,754,795 | 173754795 | $138,321,485 | 138321485 | $35,433,310 | 35433310 |
| 2021 | $172,772,247 | 172772247 | $129,635,938 | 129635938 | $43,136,309 | 43136309 |
| 2022 | $137,371,867 | 137371867 | $147,002,411 | 147002411 | $-9,630,544 | -9630544 |
| 2023 | $125,965,667 | 125965667 | $158,155,877 | 158155877 | $-32,190,210 | -32190210 |
| 2024 | $113,041,666 | 113041666 | $133,074,721 | 133074721 | $-20,033,055 | -20033055 |
| 2025 | $42,875,000 | 42875000 | $94,180,059 | 94180059 | $-51,305,059 | -51305059 |
| 2026 | $40,375,000 | 40375000 | $74,818,461 | 74818461 | $-34,443,461 | -34443461 |
| 2027 | $5,375,000 | 5375000 | $56,972,319 | 56972319 | $-51,597,319 | -51597319 |
| 2028 | $7,375,000 | 7375000 | $45,437,759 | 45437759 | $-38,062,759 | -38062759 |
| 2029 | $9,375,000 | 9375000 | $37,269,628 | 37269628 | $-27,894,628 | -27894628 |
| 2030 | $9,375,000 | 9375000 | $39,665,769 | 39665769 | $-30,290,769 | -30290769 |
|
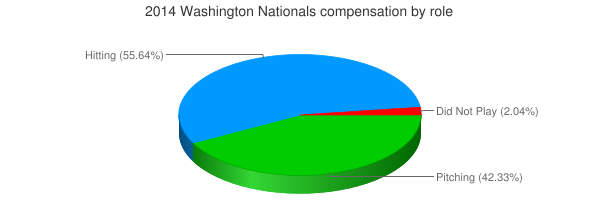
 2014 Washington Nationals