| Player | Player Sort | Pos | Salary | Salary Sort | Pct | Pct Sort | WARP | WARP Sort | WARP/$M | WARP/$M Sort | $/WARP | $/WARP Sort | Current Status |
|---|
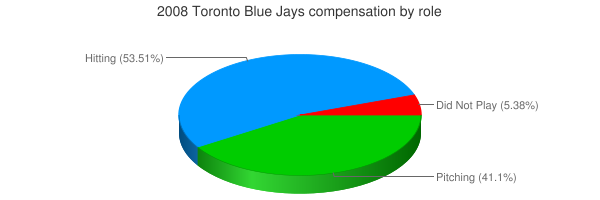
 A.J. Burnett
 |
Burnett A.J. |
RP |
$13,200,000 |
13200000 |
12.65% |
12.65 |
5.16 |
5.16001 |
0.39 |
0.39090984848485 |
$2,558,135 |
2558134.5772586 |
|
 Frank Thomas
 |
Thomas Frank |
DH |
$12,560,000 |
12560000 |
12.03% |
12.03 |
-0.24 |
-0.237045 |
— |
0 |
— |
0 |
|
 B.J. Ryan
 |
Ryan B.J. |
RP |
$12,000,000 |
12000000 |
11.50% |
11.50 |
0.96 |
0.964539 |
0.08 |
0.08037825 |
$12,441,177 |
12441176.562067 |
|
 Scott Rolen
 |
Rolen Scott |
3B |
$11,000,000 |
11000000 |
10.54% |
10.54 |
2.77 |
2.76739 |
0.25 |
0.25158090909091 |
$3,974,864 |
3974864.4029212 |
|
 Roy Halladay
 |
Halladay Roy |
RP |
$10,000,000 |
10000000 |
9.58% |
9.58 |
7.72 |
7.71993 |
0.77 |
0.771993 |
$1,295,349 |
1295348.532953 |
|
 Lyle Overbay
 |
Overbay Lyle |
1B |
$5,800,000 |
5800000 |
5.56% |
5.56 |
2.42 |
2.41789 |
0.42 |
0.4168775862069 |
$2,398,786 |
2398785.7181261 |
|
 Alex Rios
 |
Rios Alex |
RF |
$4,835,000 |
4835000 |
4.63% |
4.63 |
4.96 |
4.95556 |
1.02 |
1.0249348500517 |
$975,672 |
975671.77069796 |
|
 Alex Gonzalez
 |
Gonzalez Alex |
DNP |
$4,625,000 |
4625000 |
4.43% |
4.43 |
— |
0.00 |
— |
0 |
— |
0 |
|
 David Eckstein
 |
Eckstein David |
SS |
$4,500,000 |
4500000 |
4.31% |
4.31 |
0.93 |
0.925077 |
0.21 |
0.20557266666667 |
$4,864,460 |
4864459.9314435 |
|
 Gregg Zaun
 |
Zaun Gregg |
C |
$3,750,000 |
3750000 |
3.59% |
3.59 |
1.94 |
1.94172 |
0.52 |
0.517792 |
$1,931,277 |
1931277.4241394 |
|
 Vernon Wells
 |
Wells Vernon |
CF |
$3,687,500 |
3687500 |
3.53% |
3.53 |
2.50 |
2.49763 |
0.68 |
0.67732338983051 |
$1,476,400 |
1476399.6268463 |
|
 Matt Stairs
 |
Stairs Matt |
DH |
$2,250,000 |
2250000 |
2.16% |
2.16 |
0.04 |
0.0425577 |
0.02 |
0.018914533333333 |
$52,869,398 |
52869398.48723 |
|
 Scott Downs
 |
Downs Scott |
RP |
$2,250,000 |
2250000 |
2.16% |
2.16 |
1.43 |
1.43164 |
0.64 |
0.63628444444444 |
$1,571,624 |
1571624.151323 |
|
 John McDonald
 |
McDonald John |
SS |
$1,900,000 |
1900000 |
1.82% |
1.82 |
-1.07 |
-1.06588 |
— |
0 |
— |
0 |
|
 José Bautista
 |
Bautista Jose |
3B |
$1,800,000 |
1800000 |
1.72% |
1.72 |
-0.15 |
-0.146387 |
— |
0 |
— |
0 |
|
 Marco Scutaro
 |
Scutaro Marco |
SS |
$1,550,000 |
1550000 |
1.49% |
1.49 |
3.90 |
3.89725 |
2.51 |
2.5143548387097 |
$397,716 |
397716.33844377 |
|
 Shannon Stewart
 |
Stewart Shannon |
LF |
$1,500,000 |
1500000 |
1.44% |
1.44 |
0.08 |
0.0812257 |
0.05 |
0.054150466666667 |
$18,467,062 |
18467061.53348 |
|
 Rod Barajas
 |
Barajas Rod |
C |
$1,200,000 |
1200000 |
1.15% |
1.15 |
0.93 |
0.93249 |
0.78 |
0.777075 |
$1,286,877 |
1286877.0710678 |
|
 Jason Frasor
 |
Frasor Jason |
RP |
$1,125,000 |
1125000 |
1.08% |
1.08 |
0.14 |
0.136141 |
0.12 |
0.12101422222222 |
$8,263,492 |
8263491.5271667 |
|
 Brian Tallet
 |
Tallet Brian |
RP |
$640,000 |
640000 |
0.61% |
0.61 |
1.02 |
1.01781 |
1.59 |
1.590328125 |
$628,801 |
628801.05324176 |
|
 Kevin Mench
 |
Mench Kevin |
LF |
$600,000 |
600000 |
0.57% |
0.57 |
0.39 |
0.389957 |
0.65 |
0.64992833333333 |
$1,538,631 |
1538631.1824124 |
|
 Aaron Hill
 |
Hill Aaron |
2B |
$410,000 |
410000 |
0.39% |
0.39 |
0.37 |
0.369861 |
0.90 |
0.9021 |
$1,108,525 |
1108524.5538189 |
|
 Dustin McGowan
 |
McGowan Dustin |
RP |
$404,100 |
404100 |
0.39% |
0.39 |
1.44 |
1.44412 |
3.57 |
3.5736698836922 |
$279,824 |
279824.39132482 |
|
 Casey Janssen
 |
Janssen Casey |
DNP |
$403,900 |
403900 |
0.39% |
0.39 |
— |
0.00 |
— |
0 |
— |
0 |
|
 Shaun Marcum
 |
Marcum Shaun |
RP |
$402,500 |
402500 |
0.39% |
0.39 |
3.42 |
3.4179 |
8.49 |
8.4916770186335 |
$117,762 |
117762.36870593 |
|
 Brandon League
 |
League Brandon |
RP |
$400,300 |
400300 |
0.38% |
0.38 |
-0.05 |
-0.0458763 |
— |
0 |
— |
0 |
|
 Jesse Litsch
 |
Litsch Jesse |
RP |
$395,800 |
395800 |
0.38% |
0.38 |
3.67 |
3.66878 |
9.27 |
9.2692774128348 |
$107,883 |
107883.27454903 |
|
 Brian Wolfe
 |
Wolfe Brian |
RP |
$395,500 |
395500 |
0.38% |
0.38 |
0.34 |
0.335437 |
0.85 |
0.84813400758533 |
$1,179,059 |
1179058.9589103 |
|
 Jeremy Accardo
 |
Accardo Jeremy |
RP |
$392,200 |
392200 |
0.38% |
0.38 |
-0.08 |
-0.0769366 |
— |
0 |
— |
0 |
|
 Buck Coats
 |
Coats Buck |
LF |
$392,000 |
392000 |
0.38% |
0.38 |
-0.14 |
-0.143946 |
— |
0 |
— |
0 |
|
| Year | Blue Jays payroll |
PR Sort |
Avg payroll |
AvgPR Sort |
Diff |
Diff Sort |
|---|
| 2000 | $45,518,332 | 45518332 | $56,164,089 | 56164089 | $-10,645,757 | -10645757 |
| 2001 | $76,322,999 | 76322999 | $65,991,638 | 65991638 | $10,331,361 | 10331361 |
| 2002 | $76,464,333 | 76464333 | $68,244,471 | 68244471 | $8,219,862 | 8219862 |
| 2003 | $49,679,000 | 49679000 | $71,318,479 | 71318479 | $-21,639,479 | -21639479 |
| 2004 | $49,018,000 | 49018000 | $70,466,961 | 70466961 | $-21,448,961 | -21448961 |
| 2005 | $45,801,500 | 45801500 | $73,264,780 | 73264780 | $-27,463,280 | -27463280 |
| 2006 | $69,295,000 | 69295000 | $79,051,754 | 79051754 | $-9,756,754 | -9756754 |
| 2007 | $84,315,000 | 84315000 | $83,931,138 | 83931138 | $383,862 | 383862 |
| 2008 | $104,368,800 | 104368800 | $90,812,373 | 90812373 | $13,556,427 | 13556427 |
| 2009 | $81,842,100 | 81842100 | $91,093,211 | 91093211 | $-9,251,111 | -9251111 |
| 2010 | $76,189,000 | 76189000 | $93,373,681 | 93373681 | $-17,184,681 | -17184681 |
| 2011 | $70,317,800 | 70317800 | $96,102,034 | 96102034 | $-25,784,234 | -25784234 |
| 2012 | $83,739,200 | 83739200 | $100,657,138 | 100657138 | $-16,917,938 | -16917938 |
| 2013 | $127,777,800 | 127777800 | $109,024,990 | 109024990 | $18,752,810 | 18752810 |
| 2014 | $137,177,700 | 137177700 | $117,828,782 | 117828782 | $19,348,918 | 19348918 |
| 2015 | $125,915,800 | 125915800 | $127,404,244 | 127404244 | $-1,488,444 | -1488444 |
| 2016 | $136,782,027 | 136782027 | $132,219,407 | 132219407 | $4,562,620 | 4562620 |
| 2017 | $163,381,937 | 163381937 | $137,302,894 | 137302894 | $26,079,043 | 26079043 |
| 2018 | $162,037,223 | 162037223 | $136,929,168 | 136929168 | $25,108,055 | 25108055 |
| 2019 | $117,546,171 | 117546171 | $136,944,257 | 136944257 | $-19,398,086 | -19398086 |
| 2020 | $108,987,471 | 108987471 | $140,677,788 | 140677788 | $-31,690,317 | -31690317 |
| 2021 | $140,375,671 | 140375671 | $132,162,631 | 132162631 | $8,213,040 | 8213040 |
| 2022 | $166,851,121 | 166851121 | $149,374,046 | 149374046 | $17,477,075 | 17477075 |
| 2023 | $186,938,983 | 186938983 | $160,460,390 | 160460390 | $26,478,593 | 26478593 |
| 2024 | $181,399,600 | 181399600 | $135,504,022 | 135504022 | $45,895,578 | 45895578 |
| 2025 | $130,750,000 | 130750000 | $96,417,302 | 96417302 | $34,332,698 | 34332698 |
| 2026 | $95,166,667 | 95166667 | $76,694,120 | 76694120 | $18,472,547 | 18472547 |
| 2027 | $30,000,000 | 30000000 | $58,935,617 | 58935617 | $-28,935,617 | -28935617 |
| 2028 | $30,000,000 | 30000000 | $45,437,759 | 45437759 | $-15,437,759 | -15437759 |
|
 2008 Toronto Blue Jays