| Player | Player Sort | Pos | Salary | Salary Sort | Pct | Pct Sort | WARP | WARP Sort | WARP/$M | WARP/$M Sort | $/WARP | $/WARP Sort | Current Status |
|---|
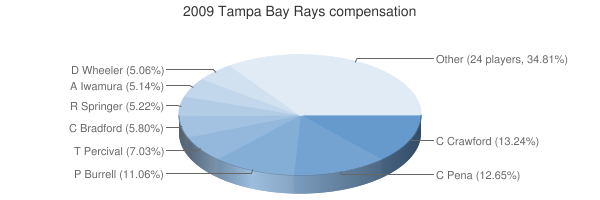
 Carl Crawford
 |
Crawford Carl |
LF |
$8,250,000 |
8250000 |
12.61% |
12.61 |
4.12 |
4.11968 |
0.50 |
0.49935515151515 |
$2,002,583 |
2002582.7248718 |
|
 Carlos Pena
 |
Pena Carlos |
1B |
$8,000,000 |
8000000 |
12.23% |
12.23 |
1.91 |
1.91489 |
0.24 |
0.23936125 |
$4,177,786 |
4177785.6691507 |
|
 Pat Burrell
 |
Burrell Pat |
DH |
$7,000,000 |
7000000 |
10.70% |
10.70 |
-0.67 |
-0.670742 |
— |
0 |
— |
0 |
|
 Scott Kazmir
 |
Kazmir Scott |
RP |
$6,000,000 |
6000000 |
9.17% |
9.17 |
1.02 |
1.02273 |
0.17 |
0.170455 |
$5,866,651 |
5866651.0222639 |
|
 Troy Percival
 |
Percival Troy |
RP |
$4,450,000 |
4450000 |
6.80% |
6.80 |
0.02 |
0.0183863 |
0.00 |
0.0041317528089888 |
$242,028,032 |
242028031.74102 |
|
 Chad Bradford
 |
Bradford Chad |
RP |
$3,666,667 |
3666667 |
5.61% |
5.61 |
-0.26 |
-0.264065 |
— |
0 |
— |
0 |
|
 Akinori Iwamura
 |
Iwamura Akinori |
2B |
$3,250,000 |
3250000 |
4.97% |
4.97 |
0.59 |
0.593909 |
0.18 |
0.18274123076923 |
$5,472,219 |
5472218.8079319 |
FA/2011 |
 Dan Wheeler
 |
Wheeler Dan |
RP |
$3,200,000 |
3200000 |
4.89% |
4.89 |
1.19 |
1.18972 |
0.37 |
0.3717875 |
$2,689,709 |
2689708.502841 |
|
 Dioner Navarro
 |
Navarro Dioner |
C |
$2,100,000 |
2100000 |
3.21% |
3.21 |
-1.10 |
-1.09871 |
— |
0 |
— |
0 |
|
 Jason Bartlett
 |
Bartlett Jason |
SS |
$1,981,250 |
1981250 |
3.03% |
3.03 |
5.04 |
5.03857 |
2.54 |
2.5431268138801 |
$393,217 |
393216.72617429 |
|
 David Price
 |
Price David |
RP |
$1,683,333 |
1683333 |
2.57% |
2.57 |
0.67 |
0.673405 |
0.40 |
0.40004265347379 |
$2,499,733 |
2499733.4442126 |
|
 James Shields
 |
Shields James |
RP |
$1,500,000 |
1500000 |
2.29% |
2.29 |
4.45 |
4.45295 |
2.97 |
2.9686333333333 |
$336,855 |
336855.34308717 |
|
 Grant Balfour
 |
Balfour Grant |
RP |
$1,400,000 |
1400000 |
2.14% |
2.14 |
0.57 |
0.567914 |
0.41 |
0.40565285714286 |
$2,465,162 |
2465161.9787503 |
|
 Brian Shouse
 |
Shouse Brian |
RP |
$1,350,000 |
1350000 |
2.06% |
2.06 |
-0.48 |
-0.478952 |
— |
0 |
— |
0 |
|
 Joe Nelson
 |
Nelson Joe |
RP |
$1,300,000 |
1300000 |
1.99% |
1.99 |
-0.34 |
-0.338156 |
— |
0 |
— |
0 |
|
 Jeff Niemann
 |
Niemann Jeff |
RP |
$1,290,000 |
1290000 |
1.97% |
1.97 |
1.03 |
1.02846 |
0.80 |
0.79725581395349 |
$1,254,303 |
1254302.5494429 |
|
 Gabe Gross
 |
Gross Gabe |
RF |
$1,255,000 |
1255000 |
1.92% |
1.92 |
-0.44 |
-0.443517 |
— |
0 |
— |
0 |
|
 Gabe Kapler
 |
Kapler Gabe |
RF |
$1,000,018 |
1000018 |
1.53% |
1.53 |
0.01 |
0.0077729 |
0.01 |
0.0077727600903184 |
$128,654,428 |
128654427.56243 |
|
 Willy Aybar
 |
Aybar Willy |
1B |
$975,000 |
975000 |
1.49% |
1.49 |
0.48 |
0.476899 |
0.49 |
0.48912717948718 |
$2,044,458 |
2044458.0508661 |
|
 Jason Isringhausen
 |
Isringhausen Jason |
RP |
$750,000 |
750000 |
1.15% |
1.15 |
-0.15 |
-0.154556 |
— |
0 |
— |
0 |
|
 Lance Cormier
 |
Cormier Lance |
RP |
$675,000 |
675000 |
1.03% |
1.03 |
1.26 |
1.25611 |
1.86 |
1.8609037037037 |
$537,373 |
537373.31921567 |
|
 Evan Longoria
 |
Longoria Evan |
3B |
$550,000 |
550000 |
0.84% |
0.84 |
5.99 |
5.9911 |
10.89 |
10.892909090909 |
$91,803 |
91802.84088064 |
|
 B.J. Upton
 |
Upton B.J. |
CF |
$435,000 |
435000 |
0.67% |
0.67 |
0.66 |
0.660907 |
1.52 |
1.5193264367816 |
$658,186 |
658186.40141503 |
|
 J.P. Howell
 |
Howell J.P. |
RP |
$433,700 |
433700 |
0.66% |
0.66 |
0.97 |
0.968855 |
2.23 |
2.2339289831681 |
$447,642 |
447641.80398512 |
|
 Matt Garza
 |
Garza Matt |
RP |
$433,300 |
433300 |
0.66% |
0.66 |
2.67 |
2.66582 |
6.15 |
6.152365566582 |
$162,539 |
162539.10616621 |
|
 Andy Sonnanstine
 |
Sonnanstine Andy |
RP |
$430,100 |
430100 |
0.66% |
0.66 |
0.65 |
0.654129 |
1.52 |
1.5208765403395 |
$657,516 |
657515.56650141 |
|
 Ben Zobrist
 |
Zobrist Ben |
2B |
$415,900 |
415900 |
0.64% |
0.64 |
6.51 |
6.50716 |
15.65 |
15.645972589565 |
$63,914 |
63914.211422495 |
|
 Shawn Riggans
 |
Riggans Shawn |
C |
$413,900 |
413900 |
0.63% |
0.63 |
-0.11 |
-0.106079 |
— |
0 |
— |
0 |
Arb2/2011, Arb3/2012 |
 Matt Joyce
 |
Joyce Matt |
RF |
$410,400 |
410400 |
0.63% |
0.63 |
0.01 |
0.0080096 |
0.02 |
0.01951656920078 |
$51,238,514 |
51238513.78346 |
|
 Fernando Perez
 |
Perez Fernando |
CF |
$402,800 |
402800 |
0.62% |
0.62 |
-0.21 |
-0.213663 |
— |
0 |
— |
0 |
|
 Eddie Morlan
 |
Morlan Eddie |
DNP |
$400,000 |
400000 |
0.61% |
0.61 |
— |
0.00 |
— |
0 |
— |
0 |
|
| Year | Rays payroll |
PR Sort |
Avg payroll |
AvgPR Sort |
Diff |
Diff Sort |
|---|
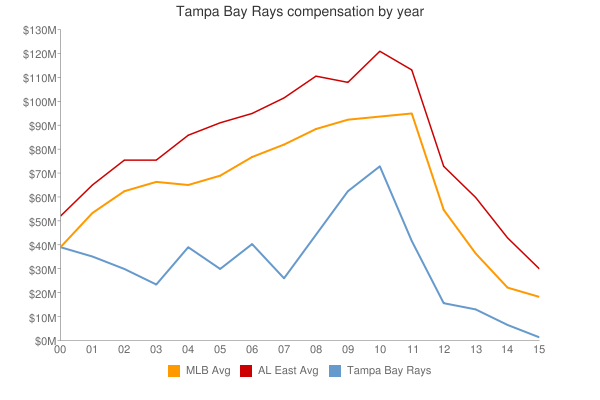
| 2000 | $62,815,129 | 62815129 | $56,164,089 | 56164089 | $6,651,040 | 6651040 |
| 2001 | $56,725,000 | 56725000 | $65,991,638 | 65991638 | $-9,266,638 | -9266638 |
| 2002 | $34,380,000 | 34380000 | $68,244,471 | 68244471 | $-33,864,471 | -33864471 |
| 2003 | $19,130,000 | 19130000 | $71,318,479 | 71318479 | $-52,188,479 | -52188479 |
| 2004 | $29,754,167 | 29754167 | $70,466,961 | 70466961 | $-40,712,794 | -40712794 |
| 2005 | $30,445,567 | 30445567 | $73,264,780 | 73264780 | $-42,819,213 | -42819213 |
| 2006 | $38,319,967 | 38319967 | $79,051,754 | 79051754 | $-40,731,787 | -40731787 |
| 2007 | $25,790,800 | 25790800 | $83,931,138 | 83931138 | $-58,140,338 | -58140338 |
| 2008 | $47,124,500 | 47124500 | $90,812,373 | 90812373 | $-43,687,873 | -43687873 |
| 2009 | $65,401,368 | 65401368 | $91,093,211 | 91093211 | $-25,691,843 | -25691843 |
| 2010 | $74,487,608 | 74487608 | $93,373,681 | 93373681 | $-18,886,073 | -18886073 |
| 2011 | $41,901,308 | 41901308 | $96,102,034 | 96102034 | $-54,200,726 | -54200726 |
| 2012 | $63,626,675 | 63626675 | $100,657,138 | 100657138 | $-37,030,463 | -37030463 |
| 2013 | $61,928,975 | 61928975 | $109,024,990 | 109024990 | $-47,096,015 | -47096015 |
| 2014 | $76,872,383 | 76872383 | $117,828,782 | 117828782 | $-40,956,399 | -40956399 |
| 2015 | $77,294,234 | 77294234 | $127,404,244 | 127404244 | $-50,110,010 | -50110010 |
| 2016 | $66,681,991 | 66681991 | $132,219,407 | 132219407 | $-65,537,416 | -65537416 |
| 2017 | $70,612,800 | 70612800 | $137,302,894 | 137302894 | $-66,690,094 | -66690094 |
| 2018 | $76,007,496 | 76007496 | $136,929,168 | 136929168 | $-60,921,672 | -60921672 |
| 2019 | $60,084,133 | 60084133 | $136,944,257 | 136944257 | $-76,860,124 | -76860124 |
| 2020 | $69,303,833 | 69303833 | $140,677,788 | 140677788 | $-71,373,955 | -71373955 |
| 2021 | $63,714,834 | 63714834 | $132,162,631 | 132162631 | $-68,447,797 | -68447797 |
| 2022 | $85,728,178 | 85728178 | $149,374,046 | 149374046 | $-63,645,868 | -63645868 |
| 2023 | $73,184,811 | 73184811 | $160,460,390 | 160460390 | $-87,275,579 | -87275579 |
| 2024 | $56,128,512 | 56128512 | $135,504,022 | 135504022 | $-79,375,510 | -79375510 |
| 2025 | $51,971,212 | 51971212 | $96,417,302 | 96417302 | $-44,446,090 | -44446090 |
| 2026 | $26,954,545 | 26954545 | $76,694,120 | 76694120 | $-49,739,575 | -49739575 |
| 2027 | $23,204,545 | 23204545 | $58,935,617 | 58935617 | $-35,731,072 | -35731072 |
| 2028 | $25,454,546 | 25454546 | $45,437,759 | 45437759 | $-19,983,213 | -19983213 |
| 2029 | $25,454,546 | 25454546 | $37,269,628 | 37269628 | $-11,815,082 | -11815082 |
| 2030 | $25,454,546 | 25454546 | $39,665,769 | 39665769 | $-14,211,223 | -14211223 |
| 2031 | $25,454,546 | 25454546 | $38,360,152 | 38360152 | $-12,905,606 | -12905606 |
| 2032 | $25,454,546 | 25454546 | $47,925,459 | 47925459 | $-22,470,913 | -22470913 |
| 2033 | $2,000,000 | 2000000 | $43,068,924 | 43068924 | $-41,068,924 | -41068924 |
|
 2009 Tampa Bay Rays