| Player | Player Sort | Pos | Salary | Salary Sort | Pct | Pct Sort | WARP | WARP Sort | WARP/$M | WARP/$M Sort | $/WARP | $/WARP Sort | Current Status |
|---|
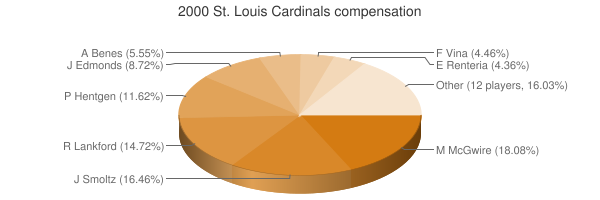
 Mark McGwire
 |
McGwire Mark |
1B |
$9,333,333 |
9333333 |
15.03% |
15.03 |
3.31 |
3.31177 |
0.35 |
0.35483251267259 |
$2,818,231 |
2818231.0365756 |
|
 Ray Lankford
 |
Lankford Ray |
LF |
$7,600,000 |
7600000 |
12.24% |
12.24 |
1.21 |
1.20953 |
0.16 |
0.15914868421053 |
$6,283,432 |
6283432.4076294 |
|
 Darryl Kile
 |
Kile Darryl |
RP |
$7,417,981 |
7417981 |
11.95% |
11.95 |
8.12 |
8.12457 |
1.10 |
1.0952535467535 |
$913,031 |
913030.59731161 |
|
 Pat Hentgen
 |
Hentgen Pat |
RP |
$6,000,000 |
6000000 |
9.66% |
9.66 |
1.40 |
1.4025 |
0.23 |
0.23375 |
$4,278,075 |
4278074.8663102 |
|
 Jim Edmonds
 |
Edmonds Jim |
CF |
$4,500,000 |
4500000 |
7.25% |
7.25 |
5.76 |
5.75704 |
1.28 |
1.2793422222222 |
$781,652 |
781651.68211442 |
|
 Eric Davis
 |
Davis Eric |
RF |
$4,500,000 |
4500000 |
7.25% |
7.25 |
0.58 |
0.577535 |
0.13 |
0.12834111111111 |
$7,791,736 |
7791735.5658099 |
|
 Andy Benes
 |
Benes Andy |
RP |
$2,867,542 |
2867542 |
4.62% |
4.62 |
3.07 |
3.0657 |
1.07 |
1.0691037829612 |
$935,363 |
935362.88612715 |
|
 J.D. Drew
 |
Drew J.D. |
RF |
$2,750,000 |
2750000 |
4.43% |
4.43 |
2.76 |
2.75696 |
1.00 |
1.0025309090909 |
$997,475 |
997475.4802391 |
|
 Scott Radinsky
 |
Radinsky Scott |
RP |
$2,500,000 |
2500000 |
4.03% |
4.03 |
-0.03 |
-0.0251559 |
— |
0 |
— |
0 |
|
 Fernando Vina
 |
Vina Fernando |
2B |
$2,300,000 |
2300000 |
3.70% |
3.70 |
1.90 |
1.89997 |
0.83 |
0.82607391304348 |
$1,210,545 |
1210545.4296647 |
|
 Edgar Renteria
 |
Renteria Edgar |
SS |
$2,250,000 |
2250000 |
3.62% |
3.62 |
2.10 |
2.1029 |
0.93 |
0.93462222222222 |
$1,069,951 |
1069951.02002 |
|
 Heathcliff Slocumb
 |
Slocumb Heathcliff |
RP |
$1,600,000 |
1600000 |
2.58% |
2.58 |
-0.54 |
-0.538853 |
— |
0 |
— |
0 |
|
 Dave Veres
 |
Veres Dave |
RP |
$1,366,667 |
1366667 |
2.20% |
2.20 |
1.65 |
1.65477 |
1.21 |
1.2108070217544 |
$825,895 |
825895.44166259 |
|
 Jesse Orosco
 |
Orosco Jesse |
RP |
$1,100,000 |
1100000 |
1.77% |
1.77 |
0.00 |
0.00322179 |
0.00 |
0.0029289 |
$341,425,108 |
341425108.40247 |
|
 Fernando Tatis
 |
Tatis Fernando |
3B |
$750,000 |
750000 |
1.21% |
1.21 |
0.96 |
0.955213 |
1.27 |
1.2736173333333 |
$785,165 |
785165.19352228 |
FA/2011 |
 Mike Matheny
 |
Matheny Mike |
C |
$750,000 |
750000 |
1.21% |
1.21 |
1.49 |
1.49347 |
1.99 |
1.9912933333333 |
$502,186 |
502186.18385371 |
|
 Mike Mohler
 |
Mohler Mike |
RP |
$690,000 |
690000 |
1.11% |
1.11 |
-0.40 |
-0.395517 |
— |
0 |
— |
0 |
|
 Thomas Howard
 |
Howard Thomas |
PH |
$650,000 |
650000 |
1.05% |
1.05 |
-0.71 |
-0.709006 |
— |
0 |
— |
0 |
|
 Shawon Dunston
 |
Dunston Shawon |
LF |
$600,000 |
600000 |
0.97% |
0.97 |
-0.25 |
-0.245959 |
— |
0 |
— |
0 |
|
 Craig Paquette
 |
Paquette Craig |
3B |
$595,000 |
595000 |
0.96% |
0.96 |
-0.06 |
-0.0580746 |
— |
0 |
— |
0 |
|
 Matt Morris
 |
Morris Matt |
RP |
$550,000 |
550000 |
0.89% |
0.89 |
0.30 |
0.302752 |
0.55 |
0.55045818181818 |
$1,816,668 |
1816668.4282845 |
|
 Garrett Stephenson
 |
Stephenson Garrett |
RP |
$550,000 |
550000 |
0.89% |
0.89 |
2.40 |
2.39606 |
4.36 |
4.3564727272727 |
$229,544 |
229543.50058012 |
|
 Eli Marrero
 |
Marrero Eli |
C |
$250,000 |
250000 |
0.40% |
0.40 |
0.33 |
0.331094 |
1.32 |
1.324376 |
$755,073 |
755072.57757616 |
|
 Placido Polanco
 |
Polanco Placido |
2B |
$220,000 |
220000 |
0.35% |
0.35 |
0.96 |
0.960977 |
4.37 |
4.3680772727273 |
$228,934 |
228933.67895381 |
|
 Rick Ankiel
 |
Ankiel Rick |
RP |
$202,500 |
202500 |
0.33% |
0.33 |
6.42 |
6.41519 |
31.68 |
31.679950617284 |
$31,566 |
31565.705770211 |
|
 D'Angelo Jimenez
 |
Jimenez D'Angelo |
DNP |
$200,000 |
200000 |
0.32% |
0.32 |
— |
0.00 |
— |
0 |
— |
0 |
|
| Year | Cardinals payroll |
PR Sort |
Avg payroll |
AvgPR Sort |
Diff |
Diff Sort |
|---|
| 1977 | $60,000 | 60000 | $60,000 | 60000 | $0 | 0 |
| 1979 | $75,000 | 75000 | $48,000 | 48000 | $27,000 | 27000 |
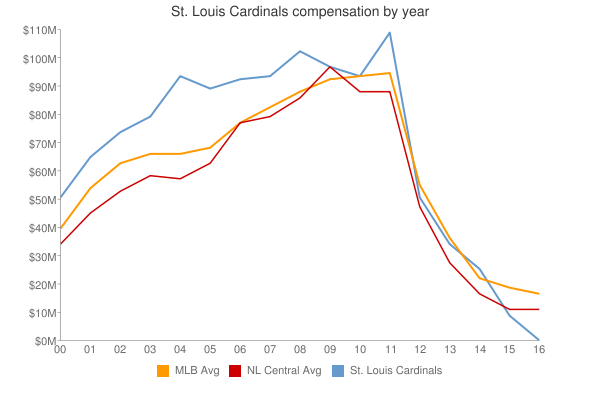
| 2000 | $62,093,023 | 62093023 | $55,368,142 | 55368142 | $6,724,881 | 6724881 |
| 2001 | $76,903,333 | 76903333 | $64,937,084 | 64937084 | $11,966,249 | 11966249 |
| 2002 | $74,425,875 | 74425875 | $67,238,672 | 67238672 | $7,187,203 | 7187203 |
| 2003 | $81,365,000 | 81365000 | $70,654,480 | 70654480 | $10,710,520 | 10710520 |
| 2004 | $81,895,000 | 81895000 | $69,466,729 | 69466729 | $12,428,271 | 12428271 |
| 2005 | $90,948,500 | 90948500 | $74,114,841 | 74114841 | $16,833,659 | 16833659 |
| 2006 | $89,093,658 | 89093658 | $79,621,815 | 79621815 | $9,471,843 | 9471843 |
| 2007 | $94,366,000 | 94366000 | $85,537,470 | 85537470 | $8,828,530 | 8828530 |
| 2008 | $99,865,500 | 99865500 | $92,003,799 | 92003799 | $7,861,701 | 7861701 |
| 2009 | $96,298,500 | 96298500 | $92,169,598 | 92169598 | $4,128,902 | 4128902 |
| 2010 | $94,220,500 | 94220500 | $94,342,601 | 94342601 | $-122,101 | -122101 |
| 2011 | $109,098,000 | 109098000 | $96,974,710 | 96974710 | $12,123,290 | 12123290 |
| 2012 | $111,858,500 | 111858500 | $100,947,217 | 100947217 | $10,911,283 | 10911283 |
| 2013 | $116,505,000 | 116505000 | $108,586,966 | 108586966 | $7,918,034 | 7918034 |
| 2014 | $111,250,000 | 111250000 | $117,131,361 | 117131361 | $-5,881,361 | -5881361 |
| 2015 | $122,066,500 | 122066500 | $126,168,161 | 126168161 | $-4,101,661 | -4101661 |
| 2016 | $145,553,500 | 145553500 | $131,756,569 | 131756569 | $13,796,931 | 13796931 |
| 2017 | $150,152,933 | 150152933 | $136,337,445 | 136337445 | $13,815,488 | 13815488 |
| 2018 | $159,698,667 | 159698667 | $135,360,600 | 135360600 | $24,338,067 | 24338067 |
| 2019 | $162,620,267 | 162620267 | $134,792,134 | 134792134 | $27,828,133 | 27828133 |
| 2020 | $166,101,500 | 166101500 | $139,496,467 | 139496467 | $26,605,033 | 26605033 |
| 2021 | $156,459,167 | 156459167 | $130,712,288 | 130712288 | $25,746,879 | 25746879 |
| 2022 | $140,285,316 | 140285316 | $149,802,695 | 149802695 | $-9,517,379 | -9517379 |
| 2023 | $180,440,183 | 180440183 | $161,692,345 | 161692345 | $18,747,838 | 18747838 |
| 2024 | $155,916,667 | 155916667 | $136,306,249 | 136306249 | $19,610,418 | 19610418 |
| 2025 | $113,906,667 | 113906667 | $98,329,527 | 98329527 | $15,577,140 | 15577140 |
| 2026 | $75,000,000 | 75000000 | $78,039,273 | 78039273 | $-3,039,273 | -3039273 |
| 2027 | $38,500,000 | 38500000 | $60,919,343 | 60919343 | $-22,419,343 | -22419343 |
| 2028 | $5,000,000 | 5000000 | $46,901,712 | 46901712 | $-41,901,712 | -41901712 |
|
 2000 St. Louis Cardinals