| Player | Player Sort | Pos | Salary | Salary Sort | Pct | Pct Sort | WARP | WARP Sort | WARP/$M | WARP/$M Sort | $/WARP | $/WARP Sort | Current Status |
|---|
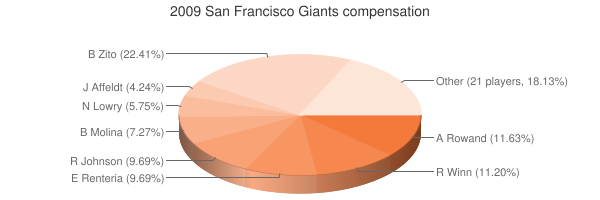
 Barry Zito
 |
Zito Barry |
RP |
$18,500,000 |
18500000 |
22.41% |
22.41 |
3.26 |
3.25639 |
0.18 |
0.17602108108108 |
$5,681,138 |
5681137.7015652 |
|
 Aaron Rowand
 |
Rowand Aaron |
CF |
$9,600,000 |
9600000 |
11.63% |
11.63 |
1.35 |
1.34858 |
0.14 |
0.14047708333333 |
$7,118,599 |
7118598.8224651 |
|
 Randy Winn
 |
Winn Randy |
RF |
$9,250,000 |
9250000 |
11.20% |
11.20 |
1.67 |
1.67311 |
0.18 |
0.18087675675676 |
$5,528,626 |
5528626.3306059 |
|
 Randy Johnson
 |
Johnson Randy |
RP |
$8,000,000 |
8000000 |
9.69% |
9.69 |
2.03 |
2.03457 |
0.25 |
0.25432125 |
$3,932,035 |
3932034.7788476 |
|
 Edgar Renteria
 |
Renteria Edgar |
SS |
$8,000,000 |
8000000 |
9.69% |
9.69 |
0.48 |
0.47556 |
0.06 |
0.059445 |
$16,822,273 |
16822272.68904 |
|
 Bengie Molina
 |
Molina Bengie |
C |
$6,000,000 |
6000000 |
7.27% |
7.27 |
1.12 |
1.12083 |
0.19 |
0.186805 |
$5,353,176 |
5353175.7715265 |
|
 Noah Lowry
 |
Lowry Noah |
DNP |
$4,750,000 |
4750000 |
5.75% |
5.75 |
— |
0.00 |
— |
0 |
— |
0 |
|
 Jeremy Affeldt
 |
Affeldt Jeremy |
RP |
$3,500,000 |
3500000 |
4.24% |
4.24 |
1.46 |
1.45916 |
0.42 |
0.41690285714286 |
$2,398,640 |
2398640.3136051 |
|
 Matt Cain
 |
Cain Matt |
RP |
$2,900,000 |
2900000 |
3.51% |
3.51 |
4.93 |
4.93309 |
1.70 |
1.7010655172414 |
$587,867 |
587866.83397222 |
|
 Bob Howry
 |
Howry Bob |
RP |
$2,750,000 |
2750000 |
3.33% |
3.33 |
0.63 |
0.633161 |
0.23 |
0.23024036363636 |
$4,343,287 |
4343287.0944357 |
|
 Juan Uribe
 |
Uribe Juan |
3B |
$1,000,000 |
1000000 |
1.21% |
1.21 |
3.60 |
3.602 |
3.60 |
3.602 |
$277,624 |
277623.5424764 |
|
 Rich Aurilia
 |
Aurilia Rich |
PH |
$1,000,000 |
1000000 |
1.21% |
1.21 |
-1.04 |
-1.03836 |
— |
0 |
— |
0 |
|
 Tim Lincecum
 |
Lincecum Tim |
RP |
$650,000 |
650000 |
0.79% |
0.79 |
7.97 |
7.9714 |
12.26 |
12.263692307692 |
$81,542 |
81541.510901473 |
|
 Brian Wilson
 |
Wilson Brian |
RP |
$480,000 |
480000 |
0.58% |
0.58 |
1.86 |
1.86197 |
3.88 |
3.8791041666667 |
$257,791 |
257791.47891749 |
|
 Brandon Medders
 |
Medders Brandon |
RP |
$475,000 |
475000 |
0.58% |
0.58 |
1.11 |
1.11096 |
2.34 |
2.3388631578947 |
$427,558 |
427558.14790812 |
|
 Jonathan Sánchez
 |
Sanchez Jonathan |
RP |
$455,000 |
455000 |
0.55% |
0.55 |
4.51 |
4.50741 |
9.91 |
9.9063956043956 |
$100,945 |
100944.888528 |
|
 Fred Lewis
 |
Lewis Fred |
LF |
$440,000 |
440000 |
0.53% |
0.53 |
1.79 |
1.78868 |
4.07 |
4.0651818181818 |
$245,991 |
245991.45738757 |
|
 Eugenio Velez
 |
Velez Eugenio |
LF |
$404,000 |
404000 |
0.49% |
0.49 |
0.85 |
0.847896 |
2.10 |
2.0987524752475 |
$476,474 |
476473.52977252 |
|
 Emmanuel Burriss
 |
Burriss Emmanuel |
2B |
$404,000 |
404000 |
0.49% |
0.49 |
-0.51 |
-0.512199 |
— |
0 |
— |
0 |
|
 Alex Hinshaw
 |
Hinshaw Alex |
RP |
$401,750 |
401750 |
0.49% |
0.49 |
-0.17 |
-0.171439 |
— |
0 |
— |
0 |
|
 Pablo Sandoval
 |
Sandoval Pablo |
3B |
$401,750 |
401750 |
0.49% |
0.49 |
5.81 |
5.81023 |
14.46 |
14.462302426882 |
$69,145 |
69145.283405304 |
|
 Sergio Romo
 |
Romo Sergio |
RP |
$401,700 |
401700 |
0.49% |
0.49 |
0.80 |
0.802233 |
2.00 |
1.9970948469007 |
$500,727 |
500727.34479883 |
|
 Nate Schierholtz
 |
Schierholtz Nate |
RF |
$401,250 |
401250 |
0.49% |
0.49 |
1.01 |
1.01127 |
2.52 |
2.5202990654206 |
$396,778 |
396778.30846362 |
|
 Merkin Valdez
 |
Valdez Merkin |
RP |
$401,000 |
401000 |
0.49% |
0.49 |
0.03 |
0.0267825 |
0.07 |
0.06678927680798 |
$14,972,463 |
14972463.36227 |
|
 Travis Ishikawa
 |
Ishikawa Travis |
1B |
$401,000 |
401000 |
0.49% |
0.49 |
0.73 |
0.734123 |
1.83 |
1.8307306733167 |
$546,230 |
546229.99143195 |
|
 Joe Martinez
 |
Martinez Joe |
RP |
$400,000 |
400000 |
0.48% |
0.48 |
0.34 |
0.336496 |
0.84 |
0.84124 |
$1,188,721 |
1188721.4112501 |
|
 Ben Copeland
 |
Copeland Ben |
DNP |
$400,000 |
400000 |
0.48% |
0.48 |
— |
0.00 |
— |
0 |
— |
0 |
|
 Kelvin Pichardo
 |
Pichardo Kelvin |
DNP |
$400,000 |
400000 |
0.48% |
0.48 |
— |
0.00 |
— |
0 |
— |
0 |
|
 Andres Torres
 |
Torres Andres |
CF |
$400,000 |
400000 |
0.48% |
0.48 |
1.73 |
1.72837 |
4.32 |
4.320925 |
$231,432 |
231431.92719152 |
|
| Year | Giants payroll |
PR Sort |
Avg payroll |
AvgPR Sort |
Diff |
Diff Sort |
|---|
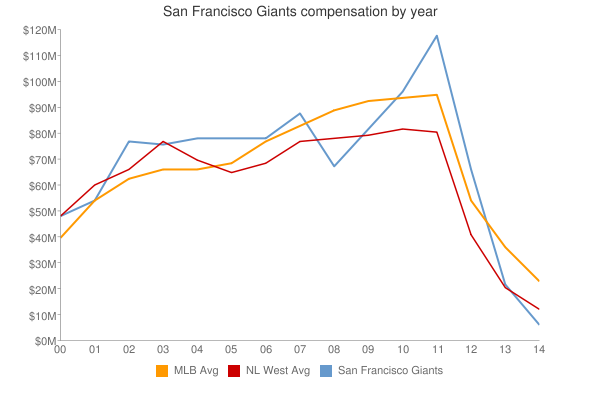
| 2000 | $53,342,826 | 53342826 | $56,164,089 | 56164089 | $-2,821,263 | -2821263 |
| 2001 | $63,289,167 | 63289167 | $65,991,638 | 65991638 | $-2,702,471 | -2702471 |
| 2002 | $78,514,835 | 78514835 | $68,244,471 | 68244471 | $10,270,364 | 10270364 |
| 2003 | $81,302,167 | 81302167 | $71,318,479 | 71318479 | $9,983,688 | 9983688 |
| 2004 | $80,400,833 | 80400833 | $70,466,961 | 70466961 | $9,933,872 | 9933872 |
| 2005 | $88,848,833 | 88848833 | $73,264,780 | 73264780 | $15,584,053 | 15584053 |
| 2006 | $90,017,671 | 90017671 | $79,051,754 | 79051754 | $10,965,917 | 10965917 |
| 2007 | $89,691,052 | 89691052 | $83,931,138 | 83931138 | $5,759,914 | 5759914 |
| 2008 | $75,877,000 | 75877000 | $90,812,373 | 90812373 | $-14,935,373 | -14935373 |
| 2009 | $82,566,450 | 82566450 | $91,093,211 | 91093211 | $-8,526,761 | -8526761 |
| 2010 | $97,023,833 | 97023833 | $93,373,681 | 93373681 | $3,650,152 | 3650152 |
| 2011 | $118,198,333 | 118198333 | $96,102,034 | 96102034 | $22,096,299 | 22096299 |
| 2012 | $131,980,298 | 131980298 | $100,657,138 | 100657138 | $31,323,160 | 31323160 |
| 2013 | $136,908,777 | 136908777 | $109,024,990 | 109024990 | $27,883,787 | 27883787 |
| 2014 | $149,439,474 | 149439474 | $117,828,782 | 117828782 | $31,610,692 | 31610692 |
| 2015 | $173,179,277 | 173179277 | $127,404,244 | 127404244 | $45,775,033 | 45775033 |
| 2016 | $172,086,611 | 172086611 | $132,219,407 | 132219407 | $39,867,204 | 39867204 |
| 2017 | $180,822,611 | 180822611 | $137,302,894 | 137302894 | $43,519,717 | 43519717 |
| 2018 | $200,505,278 | 200505278 | $136,929,168 | 136929168 | $63,576,110 | 63576110 |
| 2019 | $170,179,653 | 170179653 | $136,944,257 | 136944257 | $33,235,396 | 33235396 |
| 2020 | $155,190,747 | 155190747 | $140,677,788 | 140677788 | $14,512,959 | 14512959 |
| 2021 | $149,344,778 | 149344778 | $132,162,631 | 132162631 | $17,182,147 | 17182147 |
| 2022 | $166,189,000 | 166189000 | $149,374,046 | 149374046 | $16,814,954 | 16814954 |
| 2023 | $189,262,500 | 189262500 | $160,460,390 | 160460390 | $28,802,110 | 28802110 |
| 2024 | $189,387,903 | 189387903 | $135,504,022 | 135504022 | $53,883,881 | 53883881 |
| 2025 | $135,000,000 | 135000000 | $96,417,302 | 96417302 | $38,582,698 | 38582698 |
| 2026 | $93,750,000 | 93750000 | $76,694,120 | 76694120 | $17,055,880 | 17055880 |
| 2027 | $35,500,000 | 35500000 | $58,935,617 | 58935617 | $-23,435,617 | -23435617 |
| 2028 | $24,000,000 | 24000000 | $45,437,759 | 45437759 | $-21,437,759 | -21437759 |
|
 2009 San Francisco Giants