| Player | Player Sort | Pos | Salary | Salary Sort | Pct | Pct Sort | WARP | WARP Sort | WARP/$M | WARP/$M Sort | $/WARP | $/WARP Sort | Current Status |
|---|
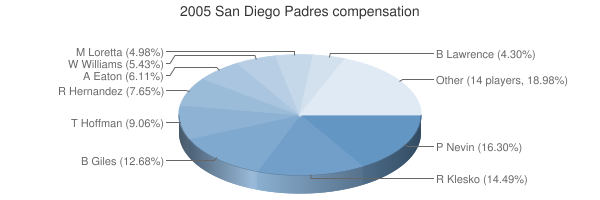
 Ryan Klesko
 |
Klesko Ryan |
LF |
$9,000,000 |
9000000 |
14.47% |
14.47 |
1.79 |
1.78971 |
0.20 |
0.19885666666667 |
$5,028,748 |
5028747.6742042 |
|
 Phil Nevin
 |
Nevin Phil |
1B |
$9,000,000 |
9000000 |
14.47% |
14.47 |
0.44 |
0.439377 |
0.05 |
0.048819666666667 |
$20,483,548 |
20483548.296793 |
|
 Brian Giles
 |
Giles Brian |
RF |
$8,833,333 |
8833333 |
14.20% |
14.20 |
6.06 |
6.06186 |
0.69 |
0.68624832778296 |
$1,457,198 |
1457198.4506406 |
|
 Trevor Hoffman
 |
Hoffman Trevor |
RP |
$5,000,000 |
5000000 |
8.04% |
8.04 |
1.82 |
1.81752 |
0.36 |
0.363504 |
$2,751,001 |
2751001.3644967 |
|
 Ramon Hernandez
 |
Hernandez Ramon |
C |
$4,225,000 |
4225000 |
6.79% |
6.79 |
1.83 |
1.83152 |
0.43 |
0.43349585798817 |
$2,306,827 |
2306827.116275 |
|
 Adam Eaton
 |
Eaton Adam |
RP |
$3,375,000 |
3375000 |
5.43% |
5.43 |
2.91 |
2.91286 |
0.86 |
0.86306962962963 |
$1,158,655 |
1158655.0675281 |
|
 Darrell May
 |
May Darrell |
RP |
$3,225,000 |
3225000 |
5.19% |
5.19 |
-0.19 |
-0.188258 |
— |
0 |
— |
0 |
|
 Woody Williams
 |
Williams Woody |
RP |
$3,000,000 |
3000000 |
4.82% |
4.82 |
2.14 |
2.14078 |
0.71 |
0.71359333333333 |
$1,401,358 |
1401358.383393 |
|
 Mark Loretta
 |
Loretta Mark |
2B |
$2,750,000 |
2750000 |
4.42% |
4.42 |
-0.43 |
-0.428696 |
— |
0 |
— |
0 |
|
 Brian Lawrence
 |
Lawrence Brian |
RP |
$2,375,000 |
2375000 |
3.82% |
3.82 |
2.08 |
2.07544 |
0.87 |
0.87386947368421 |
$1,144,336 |
1144335.6589446 |
|
 Sean Burroughs
 |
Burroughs Sean |
3B |
$1,675,000 |
1675000 |
2.69% |
2.69 |
0.51 |
0.511608 |
0.31 |
0.3054376119403 |
$3,273,991 |
3273991.024378 |
|
 Dave Roberts
 |
Roberts Dave |
CF |
$1,350,000 |
1350000 |
2.17% |
2.17 |
1.42 |
1.41997 |
1.05 |
1.0518296296296 |
$950,724 |
950724.31107699 |
|
 Scott Linebrink
 |
Linebrink Scott |
RP |
$910,000 |
910000 |
1.46% |
1.46 |
2.04 |
2.03749 |
2.24 |
2.239 |
$446,628 |
446627.95891023 |
|
 Eric Young
 |
Young Eric |
PH |
$850,000 |
850000 |
1.37% |
1.37 |
0.55 |
0.548169 |
0.64 |
0.64490470588235 |
$1,550,617 |
1550616.6893786 |
|
 Akinori Otsuka
 |
Otsuka Akinori |
RP |
$800,000 |
800000 |
1.29% |
1.29 |
1.06 |
1.0617 |
1.33 |
1.327125 |
$753,509 |
753508.52406518 |
|
 Chris Hammond
 |
Hammond Chris |
RP |
$750,000 |
750000 |
1.21% |
1.21 |
0.51 |
0.51155 |
0.68 |
0.68206666666667 |
$1,466,132 |
1466132.3428795 |
|
 Jake Peavy
 |
Peavy Jake |
RP |
$750,000 |
750000 |
1.21% |
1.21 |
7.98 |
7.97588 |
10.63 |
10.634506666667 |
$94,034 |
94033.511035773 |
|
 Tim Redding
 |
Redding Tim |
RP |
$750,000 |
750000 |
1.21% |
1.21 |
-0.05 |
-0.0521654 |
— |
0 |
— |
0 |
|
 Geoff Blum
 |
Blum Geoff |
3B |
$575,000 |
575000 |
0.92% |
0.92 |
0.54 |
0.537437 |
0.93 |
0.93467304347826 |
$1,069,893 |
1069892.8432542 |
|
 Mark Sweeney
 |
Sweeney Mark |
PH |
$550,000 |
550000 |
0.88% |
0.88 |
2.17 |
2.17148 |
3.95 |
3.9481454545455 |
$253,283 |
253283.47486507 |
|
 Rudy Seanez
 |
Seanez Rudy |
RP |
$550,000 |
550000 |
0.88% |
0.88 |
2.41 |
2.41473 |
4.39 |
4.3904181818182 |
$227,769 |
227768.73604916 |
|
 Xavier Nady
 |
Nady Xavier |
1B |
$488,000 |
488000 |
0.78% |
0.78 |
0.65 |
0.652439 |
1.34 |
1.3369651639344 |
$747,963 |
747962.64478365 |
|
 Adam Hyzdu
 |
Hyzdu Adam |
LF |
$375,000 |
375000 |
0.60% |
0.60 |
-0.02 |
-0.0180721 |
— |
0 |
— |
0 |
|
 Khalil Greene
 |
Greene Khalil |
SS |
$355,000 |
355000 |
0.57% |
0.57 |
1.71 |
1.70855 |
4.81 |
4.8128169014085 |
$207,779 |
207778.52565041 |
|
 Miguel Asencio
 |
Asencio Miguel |
DNP |
$350,000 |
350000 |
0.56% |
0.56 |
— |
0.00 |
— |
0 |
— |
0 |
|
 Miguel Ojeda
 |
Ojeda Miguel |
C |
$325,000 |
325000 |
0.52% |
0.52 |
-0.37 |
-0.373987 |
— |
0 |
— |
0 |
|
| Year | Padres payroll |
PR Sort |
Avg payroll |
AvgPR Sort |
Diff |
Diff Sort |
|---|
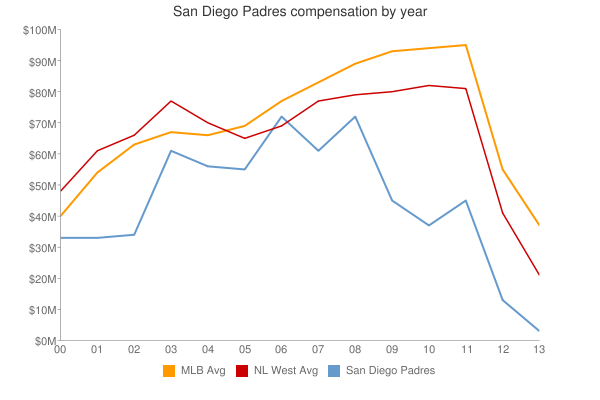
| 1996 | $2,000,000 | 2000000 | $4,583,416 | 4583416 | $-2,583,416 | -2583416 |
| 1997 | $2,000,000 | 2000000 | $4,892,222 | 4892222 | $-2,892,222 | -2892222 |
| 2000 | $53,816,000 | 53816000 | $56,164,089 | 56164089 | $-2,348,089 | -2348089 |
| 2001 | $37,438,000 | 37438000 | $65,991,638 | 65991638 | $-28,553,638 | -28553638 |
| 2002 | $40,678,000 | 40678000 | $68,244,471 | 68244471 | $-27,566,471 | -27566471 |
| 2003 | $43,565,000 | 43565000 | $71,318,479 | 71318479 | $-27,753,479 | -27753479 |
| 2004 | $59,172,333 | 59172333 | $70,466,961 | 70466961 | $-11,294,628 | -11294628 |
| 2005 | $62,186,333 | 62186333 | $73,264,780 | 73264780 | $-11,078,447 | -11078447 |
| 2006 | $69,170,167 | 69170167 | $79,051,754 | 79051754 | $-9,881,587 | -9881587 |
| 2007 | $58,571,067 | 58571067 | $83,931,138 | 83931138 | $-25,360,071 | -25360071 |
| 2008 | $74,010,117 | 74010117 | $90,812,373 | 90812373 | $-16,802,256 | -16802256 |
| 2009 | $44,173,200 | 44173200 | $91,093,211 | 91093211 | $-46,920,011 | -46920011 |
| 2010 | $37,799,300 | 37799300 | $93,373,681 | 93373681 | $-55,574,381 | -55574381 |
| 2011 | $45,869,140 | 45869140 | $96,102,034 | 96102034 | $-50,232,894 | -50232894 |
| 2012 | $55,621,900 | 55621900 | $100,657,138 | 100657138 | $-45,035,238 | -45035238 |
| 2013 | $68,333,600 | 68333600 | $109,024,990 | 109024990 | $-40,691,390 | -40691390 |
| 2014 | $90,636,600 | 90636600 | $117,828,782 | 117828782 | $-27,192,182 | -27192182 |
| 2015 | $108,387,033 | 108387033 | $127,404,244 | 127404244 | $-19,017,211 | -19017211 |
| 2016 | $100,509,500 | 100509500 | $132,219,407 | 132219407 | $-31,709,907 | -31709907 |
| 2017 | $67,624,400 | 67624400 | $137,302,894 | 137302894 | $-69,678,494 | -69678494 |
| 2018 | $94,037,733 | 94037733 | $136,929,168 | 136929168 | $-42,891,435 | -42891435 |
| 2019 | $100,804,100 | 100804100 | $136,944,257 | 136944257 | $-36,140,157 | -36140157 |
| 2020 | $151,461,550 | 151461550 | $140,677,788 | 140677788 | $10,783,762 | 10783762 |
| 2021 | $171,488,220 | 171488220 | $132,162,631 | 132162631 | $39,325,589 | 39325589 |
| 2022 | $212,846,719 | 212846719 | $149,374,046 | 149374046 | $63,472,673 | 63472673 |
| 2023 | $221,599,740 | 221599740 | $160,460,390 | 160460390 | $61,139,350 | 61139350 |
| 2024 | $153,892,054 | 153892054 | $135,504,022 | 135504022 | $18,388,032 | 18388032 |
| 2025 | $150,295,454 | 150295454 | $96,417,302 | 96417302 | $53,878,152 | 53878152 |
| 2026 | $137,745,454 | 137745454 | $76,694,120 | 76694120 | $61,051,334 | 61051334 |
| 2027 | $156,495,454 | 156495454 | $58,935,617 | 58935617 | $97,559,837 | 97559837 |
| 2028 | $124,545,454 | 124545454 | $45,437,759 | 45437759 | $79,107,695 | 79107695 |
| 2029 | $113,545,454 | 113545454 | $37,269,628 | 37269628 | $76,275,826 | 76275826 |
| 2030 | $113,545,454 | 113545454 | $39,665,769 | 39665769 | $73,879,685 | 73879685 |
| 2031 | $101,259,739 | 101259739 | $38,360,152 | 38360152 | $62,899,587 | 62899587 |
| 2032 | $101,259,739 | 101259739 | $47,925,459 | 47925459 | $53,334,280 | 53334280 |
| 2033 | $101,259,739 | 101259739 | $43,068,924 | 43068924 | $58,190,815 | 58190815 |
| 2034 | $36,714,285 | 36714285 | $29,428,571 | 29428571 | $7,285,714 | 7285714 |
|
 2005 San Diego Padres