| Player | Player Sort | Pos | Salary | Salary Sort | Pct | Pct Sort | WARP | WARP Sort | WARP/$M | WARP/$M Sort | $/WARP | $/WARP Sort | Current Status |
|---|
 Brian Giles
 |
Giles Brian |
LF |
$8,833,333 |
8833333 |
16.13% |
16.13 |
3.88 |
3.88003 |
0.44 |
0.43924869582071 |
$2,276,615 |
2276614.6138045 |
|
 Jason Kendall
 |
Kendall Jason |
C |
$8,000,000 |
8000000 |
14.61% |
14.61 |
4.08 |
4.07557 |
0.51 |
0.50944625 |
$1,962,916 |
1962915.6167113 |
|
 Kevin Young
 |
Young Kevin |
1B |
$6,500,000 |
6500000 |
11.87% |
11.87 |
-0.50 |
-0.501534 |
— |
0 |
— |
0 |
|
 Kris Benson
 |
Benson Kris |
RP |
$4,300,000 |
4300000 |
7.85% |
7.85 |
-0.25 |
-0.254607 |
— |
0 |
— |
0 |
|
 Pat Meares
 |
Meares Pat |
DNP |
$3,790,000 |
3790000 |
6.92% |
6.92 |
— |
0.00 |
— |
0 |
— |
0 |
|
 Mike Williams
 |
Williams Mike |
RP |
$3,500,000 |
3500000 |
6.39% |
6.39 |
-0.58 |
-0.581231 |
— |
0 |
— |
0 |
|
 Aramis Ramirez
 |
Ramirez Aramis |
3B |
$3,000,000 |
3000000 |
5.48% |
5.48 |
1.41 |
1.41003 |
0.47 |
0.47001 |
$2,127,614 |
2127614.3060786 |
|
 Pokey Reese
 |
Reese Pokey |
2B |
$2,500,000 |
2500000 |
4.57% |
4.57 |
0.25 |
0.249749 |
0.10 |
0.0998996 |
$10,010,050 |
10010050.090291 |
|
 Scott Sauerbeck
 |
Sauerbeck Scott |
RP |
$1,500,000 |
1500000 |
2.74% |
2.74 |
0.56 |
0.55508 |
0.37 |
0.37005333333333 |
$2,702,313 |
2702313.1800822 |
|
 Brian Boehringer
 |
Boehringer Brian |
RP |
$1,500,000 |
1500000 |
2.74% |
2.74 |
-0.49 |
-0.487028 |
— |
0 |
— |
0 |
|
 Randall Simon
 |
Simon Randall |
1B |
$1,475,000 |
1475000 |
2.69% |
2.69 |
-0.61 |
-0.610845 |
— |
0 |
— |
0 |
|
 Kenny Lofton
 |
Lofton Kenny |
CF |
$1,025,000 |
1025000 |
1.87% |
1.87 |
1.90 |
1.90161 |
1.86 |
1.8552292682927 |
$539,017 |
539016.93827862 |
|
 Reggie Sanders
 |
Sanders Reggie |
RF |
$1,000,000 |
1000000 |
1.83% |
1.83 |
2.98 |
2.98232 |
2.98 |
2.98232 |
$335,309 |
335309.42353604 |
|
 Matt Stairs
 |
Stairs Matt |
RF |
$900,000 |
900000 |
1.64% |
1.64 |
1.48 |
1.48069 |
1.65 |
1.6452111111111 |
$607,825 |
607824.7303622 |
|
 José Hernández
 |
Hernandez Jose |
3B |
$800,000 |
800000 |
1.46% |
1.46 |
0.32 |
0.321088 |
0.40 |
0.40136 |
$2,491,529 |
2491528.802073 |
|
 Jeff D'Amico
 |
D'Amico Jeff |
RP |
$750,000 |
750000 |
1.37% |
1.37 |
1.81 |
1.81119 |
2.41 |
2.41492 |
$414,092 |
414092.39229457 |
|
 Julian Tavarez
 |
Tavarez Julian |
RP |
$750,000 |
750000 |
1.37% |
1.37 |
1.04 |
1.03546 |
1.38 |
1.3806133333333 |
$724,316 |
724315.76304251 |
|
 Brian Meadows
 |
Meadows Brian |
RP |
$600,000 |
600000 |
1.10% |
1.10 |
0.66 |
0.658558 |
1.10 |
1.0975966666667 |
$911,081 |
911081.484091 |
|
 Dennys Reyes
 |
Reyes Dennys |
RP |
$600,000 |
600000 |
1.10% |
1.10 |
0.23 |
0.232875 |
0.39 |
0.388125 |
$2,576,490 |
2576489.5330113 |
|
 Jeff Suppan
 |
Suppan Jeff |
RP |
$500,000 |
500000 |
0.91% |
0.91 |
2.35 |
2.35078 |
4.70 |
4.70156 |
$212,695 |
212695.36068879 |
|
 Kip Wells
 |
Wells Kip |
RP |
$370,000 |
370000 |
0.68% |
0.68 |
4.86 |
4.86352 |
13.14 |
13.144648648649 |
$76,077 |
76076.586505247 |
|
 Jack Wilson
 |
Wilson Jack |
SS |
$335,000 |
335000 |
0.61% |
0.61 |
0.94 |
0.93947 |
2.80 |
2.8043880597015 |
$356,584 |
356584.03142197 |
|
 Craig Wilson
 |
Wilson Craig |
RF |
$327,000 |
327000 |
0.60% |
0.60 |
1.98 |
1.98121 |
6.06 |
6.05874617737 |
$165,051 |
165050.65086488 |
|
 Salomon Torres
 |
Torres Salomon |
RP |
$325,000 |
325000 |
0.59% |
0.59 |
2.01 |
2.01494 |
6.20 |
6.1998153846154 |
$161,295 |
161295.12541316 |
|
 Joe Beimel
 |
Beimel Joe |
RP |
$322,000 |
322000 |
0.59% |
0.59 |
-0.88 |
-0.882709 |
— |
0 |
— |
0 |
|
 Josh Fogg
 |
Fogg Josh |
RP |
$322,000 |
322000 |
0.59% |
0.59 |
-0.19 |
-0.193063 |
— |
0 |
— |
0 |
|
 Rob Mackowiak
 |
Mackowiak Rob |
PH |
$322,000 |
322000 |
0.59% |
0.59 |
0.59 |
0.589532 |
1.83 |
1.8308447204969 |
$546,196 |
546195.9656134 |
|
 Mike Lincoln
 |
Lincoln Mike |
RP |
$315,500 |
315500 |
0.58% |
0.58 |
0.43 |
0.425935 |
1.35 |
1.3500316957211 |
$740,723 |
740723.3498069 |
|
 Tyler Yates
 |
Yates Tyler |
DNP |
$300,000 |
300000 |
0.55% |
0.55 |
— |
0.00 |
— |
0 |
— |
0 |
FA/2011 |
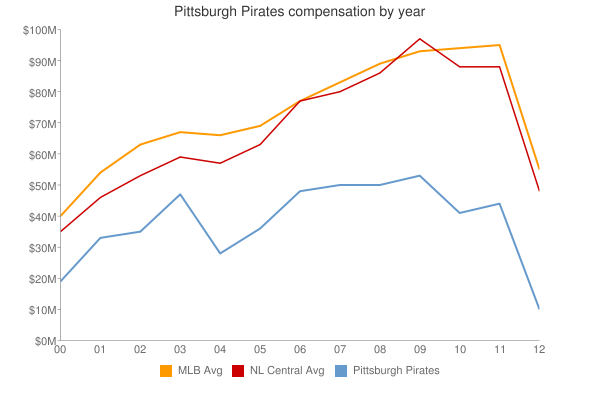
| Year | Pirates payroll |
PR Sort |
Avg payroll |
AvgPR Sort |
Diff |
Diff Sort |
|---|
| 2000 | $27,423,334 | 27423334 | $55,368,142 | 55368142 | $-27,944,808 | -27944808 |
| 2001 | $56,110,833 | 56110833 | $64,937,084 | 64937084 | $-8,826,251 | -8826251 |
| 2002 | $41,911,099 | 41911099 | $67,238,672 | 67238672 | $-25,327,573 | -25327573 |
| 2003 | $54,761,833 | 54761833 | $70,654,480 | 70654480 | $-15,892,647 | -15892647 |
| 2004 | $30,716,500 | 30716500 | $69,466,729 | 69466729 | $-38,750,229 | -38750229 |
| 2005 | $36,170,500 | 36170500 | $74,114,841 | 74114841 | $-37,944,341 | -37944341 |
| 2006 | $47,700,750 | 47700750 | $79,621,815 | 79621815 | $-31,921,065 | -31921065 |
| 2007 | $41,444,500 | 41444500 | $85,537,470 | 85537470 | $-44,092,970 | -44092970 |
| 2008 | $49,113,225 | 49113225 | $92,003,799 | 92003799 | $-42,890,574 | -42890574 |
| 2009 | $51,864,000 | 51864000 | $92,169,598 | 92169598 | $-40,305,598 | -40305598 |
| 2010 | $38,668,000 | 38668000 | $94,342,601 | 94342601 | $-55,674,601 | -55674601 |
| 2011 | $44,485,667 | 44485667 | $96,974,710 | 96974710 | $-52,489,043 | -52489043 |
| 2012 | $51,932,000 | 51932000 | $100,947,217 | 100947217 | $-49,015,217 | -49015217 |
| 2013 | $66,805,000 | 66805000 | $108,586,966 | 108586966 | $-41,781,966 | -41781966 |
| 2014 | $71,929,333 | 71929333 | $117,131,361 | 117131361 | $-45,202,028 | -45202028 |
| 2015 | $90,303,000 | 90303000 | $126,168,161 | 126168161 | $-35,865,161 | -35865161 |
| 2016 | $99,945,500 | 99945500 | $131,756,569 | 131756569 | $-31,811,069 | -31811069 |
| 2017 | $95,807,004 | 95807004 | $136,337,445 | 136337445 | $-40,530,441 | -40530441 |
| 2018 | $86,340,001 | 86340001 | $135,360,600 | 135360600 | $-49,020,599 | -49020599 |
| 2019 | $74,808,000 | 74808000 | $134,792,134 | 134792134 | $-59,984,134 | -59984134 |
| 2020 | $53,939,500 | 53939500 | $139,496,467 | 139496467 | $-85,556,967 | -85556967 |
| 2021 | $55,452,000 | 55452000 | $130,712,288 | 130712288 | $-75,260,288 | -75260288 |
| 2022 | $55,761,800 | 55761800 | $149,802,695 | 149802695 | $-94,040,895 | -94040895 |
| 2023 | $72,777,500 | 72777500 | $161,692,345 | 161692345 | $-88,914,845 | -88914845 |
| 2024 | $53,029,000 | 53029000 | $136,306,249 | 136306249 | $-83,277,249 | -83277249 |
| 2025 | $34,661,500 | 34661500 | $98,329,527 | 98329527 | $-63,668,027 | -63668027 |
| 2026 | $38,161,500 | 38161500 | $78,039,273 | 78039273 | $-39,877,773 | -39877773 |
| 2027 | $40,661,500 | 40661500 | $60,919,343 | 60919343 | $-20,257,843 | -20257843 |
| 2028 | $43,661,500 | 43661500 | $46,901,712 | 46901712 | $-3,240,212 | -3240212 |
| 2029 | $23,250,000 | 23250000 | $38,597,944 | 38597944 | $-15,347,944 | -15347944 |
| 2030 | $21,250,000 | 21250000 | $41,447,579 | 41447579 | $-20,197,579 | -20197579 |
| 2031 | $2,000,000 | 2000000 | $38,360,152 | 38360152 | $-36,360,152 | -36360152 |
|
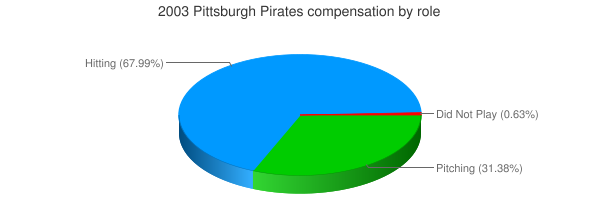
 2003 Pittsburgh Pirates