| Player | Player Sort | Pos | Salary | Salary Sort | Pct | Pct Sort | WARP | WARP Sort | WARP/$M | WARP/$M Sort | $/WARP | $/WARP Sort | Current Status |
|---|
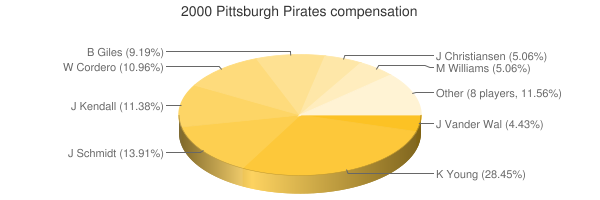
 Kevin Young
 |
Young Kevin |
1B |
$5,625,000 |
5625000 |
20.51% |
20.51 |
-1.91 |
-1.90609 |
— |
0 |
— |
0 |
|
 Pat Meares
 |
Meares Pat |
SS |
$3,290,000 |
3290000 |
12.00% |
12.00 |
0.33 |
0.327161 |
0.10 |
0.09944103343465 |
$10,056,211 |
10056210.856428 |
|
 Jason Schmidt
 |
Schmidt Jason |
RP |
$2,750,000 |
2750000 |
10.03% |
10.03 |
-0.42 |
-0.42375 |
— |
0 |
— |
0 |
|
 Jason Kendall
 |
Kendall Jason |
C |
$2,250,000 |
2250000 |
8.20% |
8.20 |
2.46 |
2.46114 |
1.09 |
1.09384 |
$914,210 |
914210.48782272 |
|
 Wil Cordero
 |
Cordero Wil |
LF |
$2,166,667 |
2166667 |
7.90% |
7.90 |
-1.10 |
-1.10235 |
— |
0 |
— |
0 |
|
 Francisco Cordova
 |
Cordova Francisco |
RP |
$2,050,000 |
2050000 |
7.48% |
7.48 |
0.15 |
0.153365 |
0.07 |
0.074812195121951 |
$13,366,805 |
13366804.681642 |
|
 Brian Giles
 |
Giles Brian |
CF |
$1,816,667 |
1816667 |
6.62% |
6.62 |
5.54 |
5.53998 |
3.05 |
3.0495297156826 |
$327,919 |
327919.41487153 |
|
 Jason Christiansen
 |
Christiansen Jason |
RP |
$1,000,000 |
1000000 |
3.65% |
3.65 |
0.57 |
0.565383 |
0.57 |
0.565383 |
$1,768,713 |
1768712.5364576 |
|
 Mike Williams
 |
Williams Mike |
RP |
$1,000,000 |
1000000 |
3.65% |
3.65 |
0.87 |
0.871098 |
0.87 |
0.871098 |
$1,147,976 |
1147976.4618906 |
|
 John Vander Wal
 |
Vander Wal John |
RF |
$875,000 |
875000 |
3.19% |
3.19 |
2.52 |
2.52228 |
2.88 |
2.8826057142857 |
$346,908 |
346908.3527602 |
|
 Marc Wilkins
 |
Wilkins Marc |
RP |
$750,000 |
750000 |
2.73% |
2.73 |
-1.49 |
-1.49235 |
— |
0 |
— |
0 |
|
 Mike Benjamin
 |
Benjamin Mike |
3B |
$700,000 |
700000 |
2.55% |
2.55 |
0.67 |
0.66643 |
0.95 |
0.95204285714286 |
$1,050,373 |
1050372.8823732 |
|
 Luis Sojo
 |
Sojo Luis |
3B |
$450,000 |
450000 |
1.64% |
1.64 |
-0.13 |
-0.125597 |
— |
0 |
— |
0 |
|
 Rich Loiselle
 |
Loiselle Rich |
RP |
$400,000 |
400000 |
1.46% |
1.46 |
-0.41 |
-0.413131 |
— |
0 |
— |
0 |
|
 Keith Osik
 |
Osik Keith |
C |
$400,000 |
400000 |
1.46% |
1.46 |
0.73 |
0.73098 |
1.83 |
1.82745 |
$547,211 |
547210.5939971 |
|
 Todd Ritchie
 |
Ritchie Todd |
RP |
$380,000 |
380000 |
1.39% |
1.39 |
3.57 |
3.56591 |
9.38 |
9.3839736842105 |
$106,565 |
106564.66371838 |
|
 Kris Benson
 |
Benson Kris |
RP |
$300,000 |
300000 |
1.09% |
1.09 |
4.41 |
4.41261 |
14.71 |
14.7087 |
$67,987 |
67986.97369584 |
|
 Scott Sauerbeck
 |
Sauerbeck Scott |
RP |
$285,000 |
285000 |
1.04% |
1.04 |
0.76 |
0.757965 |
2.66 |
2.6595263157895 |
$376,007 |
376006.8077022 |
|
 Adrian Brown
 |
Brown Adrian |
CF |
$285,000 |
285000 |
1.04% |
1.04 |
1.15 |
1.14958 |
4.03 |
4.0336140350877 |
$247,917 |
247916.63042155 |
|
 Aramis Ramirez
 |
Ramirez Aramis |
3B |
$230,000 |
230000 |
0.84% |
0.84 |
-0.92 |
-0.917014 |
— |
0 |
— |
0 |
|
 Jimmy Anderson
 |
Anderson Jimmy |
RP |
$215,000 |
215000 |
0.78% |
0.78 |
-0.82 |
-0.82363 |
— |
0 |
— |
0 |
|
 Chad Hermansen
 |
Hermansen Chad |
CF |
$205,000 |
205000 |
0.75% |
0.75 |
-1.41 |
-1.40881 |
— |
0 |
— |
0 |
|
| Year | Pirates payroll |
PR Sort |
Avg payroll |
AvgPR Sort |
Diff |
Diff Sort |
|---|
| 2000 | $27,423,334 | 27423334 | $55,368,142 | 55368142 | $-27,944,808 | -27944808 |
| 2001 | $56,110,833 | 56110833 | $64,937,084 | 64937084 | $-8,826,251 | -8826251 |
| 2002 | $41,911,099 | 41911099 | $67,238,672 | 67238672 | $-25,327,573 | -25327573 |
| 2003 | $54,761,833 | 54761833 | $70,654,480 | 70654480 | $-15,892,647 | -15892647 |
| 2004 | $30,716,500 | 30716500 | $69,466,729 | 69466729 | $-38,750,229 | -38750229 |
| 2005 | $36,170,500 | 36170500 | $74,114,841 | 74114841 | $-37,944,341 | -37944341 |
| 2006 | $47,700,750 | 47700750 | $79,621,815 | 79621815 | $-31,921,065 | -31921065 |
| 2007 | $41,444,500 | 41444500 | $85,537,470 | 85537470 | $-44,092,970 | -44092970 |
| 2008 | $49,113,225 | 49113225 | $92,003,799 | 92003799 | $-42,890,574 | -42890574 |
| 2009 | $51,864,000 | 51864000 | $92,169,598 | 92169598 | $-40,305,598 | -40305598 |
| 2010 | $38,668,000 | 38668000 | $94,342,601 | 94342601 | $-55,674,601 | -55674601 |
| 2011 | $44,485,667 | 44485667 | $96,974,710 | 96974710 | $-52,489,043 | -52489043 |
| 2012 | $51,932,000 | 51932000 | $100,947,217 | 100947217 | $-49,015,217 | -49015217 |
| 2013 | $66,805,000 | 66805000 | $108,586,966 | 108586966 | $-41,781,966 | -41781966 |
| 2014 | $71,929,333 | 71929333 | $117,131,361 | 117131361 | $-45,202,028 | -45202028 |
| 2015 | $90,303,000 | 90303000 | $126,168,161 | 126168161 | $-35,865,161 | -35865161 |
| 2016 | $99,945,500 | 99945500 | $131,756,569 | 131756569 | $-31,811,069 | -31811069 |
| 2017 | $95,807,004 | 95807004 | $136,337,445 | 136337445 | $-40,530,441 | -40530441 |
| 2018 | $86,340,001 | 86340001 | $135,360,600 | 135360600 | $-49,020,599 | -49020599 |
| 2019 | $74,808,000 | 74808000 | $134,792,134 | 134792134 | $-59,984,134 | -59984134 |
| 2020 | $53,939,500 | 53939500 | $139,496,467 | 139496467 | $-85,556,967 | -85556967 |
| 2021 | $55,452,000 | 55452000 | $130,712,288 | 130712288 | $-75,260,288 | -75260288 |
| 2022 | $55,761,800 | 55761800 | $149,802,695 | 149802695 | $-94,040,895 | -94040895 |
| 2023 | $72,777,500 | 72777500 | $161,692,345 | 161692345 | $-88,914,845 | -88914845 |
| 2024 | $53,029,000 | 53029000 | $136,306,249 | 136306249 | $-83,277,249 | -83277249 |
| 2025 | $34,661,500 | 34661500 | $98,329,527 | 98329527 | $-63,668,027 | -63668027 |
| 2026 | $38,161,500 | 38161500 | $78,039,273 | 78039273 | $-39,877,773 | -39877773 |
| 2027 | $40,661,500 | 40661500 | $60,919,343 | 60919343 | $-20,257,843 | -20257843 |
| 2028 | $43,661,500 | 43661500 | $46,901,712 | 46901712 | $-3,240,212 | -3240212 |
| 2029 | $23,250,000 | 23250000 | $38,597,944 | 38597944 | $-15,347,944 | -15347944 |
| 2030 | $21,250,000 | 21250000 | $41,447,579 | 41447579 | $-20,197,579 | -20197579 |
| 2031 | $2,000,000 | 2000000 | $38,360,152 | 38360152 | $-36,360,152 | -36360152 |
|
 2000 Pittsburgh Pirates