| Player | Player Sort | Pos | Salary | Salary Sort | Pct | Pct Sort | WARP | WARP Sort | WARP/$M | WARP/$M Sort | $/WARP | $/WARP Sort | Current Status |
|---|
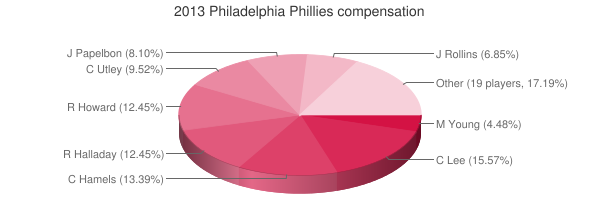
 Cliff Lee
 |
Lee Cliff |
RP |
$25,000,000 |
25000000 |
15.57% |
15.57 |
6.41 |
6.41377 |
0.26 |
0.2565508 |
$3,897,864 |
3897863.5030567 |
|
 Cole Hamels
 |
Hamels Cole |
RP |
$21,500,000 |
21500000 |
13.39% |
13.39 |
5.10 |
5.10119 |
0.24 |
0.23726465116279 |
$4,214,703 |
4214702.8438462 |
|
 Ryan Howard
 |
Howard Ryan |
1B |
$20,000,000 |
20000000 |
12.45% |
12.45 |
0.61 |
0.608667 |
0.03 |
0.03043335 |
$32,858,690 |
32858689.562602 |
|
 Roy Halladay
 |
Halladay Roy |
RP |
$20,000,000 |
20000000 |
12.45% |
12.45 |
-0.60 |
-0.603757 |
— |
0 |
— |
0 |
|
 Chase Utley
 |
Utley Chase |
2B |
$15,285,714 |
15285714 |
9.52% |
9.52 |
3.38 |
3.37751 |
0.22 |
0.22095860226091 |
$4,525,735 |
4525734.6388316 |
|
 Jonathan Papelbon
 |
Papelbon Jonathan |
RP |
$13,000,000 |
13000000 |
8.10% |
8.10 |
0.72 |
0.716415 |
0.06 |
0.055108846153846 |
$18,145,907 |
18145907.051081 |
|
 Jimmy Rollins
 |
Rollins Jimmy |
SS |
$11,000,000 |
11000000 |
6.85% |
6.85 |
1.20 |
1.20043 |
0.11 |
0.10913 |
$9,163,383 |
9163383.1210483 |
|
 Michael Young
 |
Young Michael |
3B |
$7,200,000 |
7200000 |
4.48% |
4.48 |
-0.70 |
-0.703916 |
— |
0 |
— |
0 |
|
 Mike Adams
 |
Adams Mike |
RP |
$5,000,000 |
5000000 |
3.11% |
3.11 |
0.22 |
0.220774 |
0.04 |
0.0441548 |
$22,647,594 |
22647594.372526 |
|
 Carlos Ruiz
 |
Ruiz Carlos |
C |
$5,000,000 |
5000000 |
3.11% |
3.11 |
1.16 |
1.16028 |
0.23 |
0.232056 |
$4,309,305 |
4309304.6506016 |
|
 Kyle Kendrick
 |
Kendrick Kyle |
RP |
$4,500,000 |
4500000 |
2.80% |
2.80 |
2.14 |
2.14233 |
0.48 |
0.47607333333333 |
$2,100,517 |
2100516.7271149 |
|
 John Lannan
 |
Lannan John |
RP |
$2,500,000 |
2500000 |
1.56% |
1.56 |
-0.59 |
-0.585851 |
— |
0 |
— |
0 |
|
 Antonio Bastardo
 |
Bastardo Antonio |
RP |
$1,400,000 |
1400000 |
0.87% |
0.87 |
0.61 |
0.605791 |
0.43 |
0.43270785714286 |
$2,311,028 |
2311028.0608329 |
|
 Laynce Nix
 |
Nix Laynce |
PH |
$1,350,000 |
1350000 |
0.84% |
0.84 |
-0.73 |
-0.733206 |
— |
0 |
— |
0 |
|
 Humberto Quintero
 |
Quintero Humberto |
C |
$900,000 |
900000 |
0.56% |
0.56 |
-0.07 |
-0.0670839 |
— |
0 |
— |
0 |
|
 Kevin Frandsen
 |
Frandsen Kevin |
PH |
$850,000 |
850000 |
0.53% |
0.53 |
-0.53 |
-0.528055 |
— |
0 |
— |
0 |
|
 Chad Durbin
 |
Durbin Chad |
RP |
$850,000 |
850000 |
0.53% |
0.53 |
0.07 |
0.0747294 |
0.09 |
0.087916941176471 |
$11,374,372 |
11374372.067754 |
|
 Delmon Young
 |
Young Delmon |
RF |
$750,000 |
750000 |
0.47% |
0.47 |
0.04 |
0.0366125 |
0.05 |
0.048816666666667 |
$20,484,807 |
20484807.1014 |
|
 John Mayberry Jr.
 |
Mayberry John |
RF |
$517,000 |
517000 |
0.32% |
0.32 |
-0.16 |
-0.15948 |
— |
0 |
— |
0 |
|
 Ben Revere
 |
Revere Ben |
CF |
$515,000 |
515000 |
0.32% |
0.32 |
1.83 |
1.83006 |
3.55 |
3.5535145631068 |
$281,412 |
281411.53841951 |
|
 Raul Valdes
 |
Valdes Raul |
RP |
$505,000 |
505000 |
0.31% |
0.31 |
0.24 |
0.237542 |
0.47 |
0.4703801980198 |
$2,125,940 |
2125939.8337978 |
|
 Domonic Brown
 |
Brown Domonic |
LF |
$500,000 |
500000 |
0.31% |
0.31 |
2.23 |
2.22587 |
4.45 |
4.45174 |
$224,631 |
224631.26777395 |
|
 Jeremy Horst
 |
Horst Jeremy |
RP |
$497,000 |
497000 |
0.31% |
0.31 |
-0.40 |
-0.399844 |
— |
0 |
— |
0 |
|
 Erik Kratz
 |
Kratz Erik |
C |
$496,000 |
496000 |
0.31% |
0.31 |
0.86 |
0.85861 |
1.73 |
1.7310685483871 |
$577,678 |
577677.87470446 |
|
 Ender Inciarte
 |
Inciarte Ender |
DNP |
$490,000 |
490000 |
0.31% |
0.31 |
— |
0.00 |
— |
0 |
— |
0 |
|
 Freddy Galvis
 |
Galvis Freddy |
2B |
$490,000 |
490000 |
0.31% |
0.31 |
0.40 |
0.39714 |
0.81 |
0.81048979591837 |
$1,233,822 |
1233821.8260563 |
|
 Phillippe Aumont
 |
Aumont Phillippe |
RP |
$490,000 |
490000 |
0.31% |
0.31 |
-0.59 |
-0.587677 |
— |
0 |
— |
0 |
|
| Year | Phillies payroll |
PR Sort |
Avg payroll |
AvgPR Sort |
Diff |
Diff Sort |
|---|
| 2000 | $47,011,333 | 47011333 | $57,491,092 | 57491092 | $-10,479,759 | -10479759 |
| 2001 | $41,911,166 | 41911166 | $67,120,750 | 67120750 | $-25,209,584 | -25209584 |
| 2002 | $58,167,499 | 58167499 | $69,204,705 | 69204705 | $-11,037,206 | -11037206 |
| 2003 | $69,676,667 | 69676667 | $72,156,639 | 72156639 | $-2,479,972 | -2479972 |
| 2004 | $92,444,167 | 92444167 | $71,426,357 | 71426357 | $21,017,810 | 21017810 |
| 2005 | $95,625,667 | 95625667 | $73,628,169 | 73628169 | $21,997,498 | 21997498 |
| 2006 | $87,642,000 | 87642000 | $81,192,832 | 81192832 | $6,449,168 | 6449168 |
| 2007 | $89,839,547 | 89839547 | $85,747,487 | 85747487 | $4,092,060 | 4092060 |
| 2008 | $96,735,047 | 96735047 | $93,079,041 | 93079041 | $3,656,006 | 3656006 |
| 2009 | $131,087,380 | 131087380 | $92,957,049 | 92957049 | $38,130,331 | 38130331 |
| 2010 | $144,178,379 | 144178379 | $94,957,956 | 94957956 | $49,220,423 | 49220423 |
| 2011 | $165,976,381 | 165976381 | $97,426,414 | 97426414 | $68,549,967 | 68549967 |
| 2012 | $172,093,283 | 172093283 | $100,689,500 | 100689500 | $71,403,783 | 71403783 |
| 2013 | $160,585,714 | 160585714 | $106,658,387 | 106658387 | $53,927,327 | 53927327 |
| 2014 | $178,729,967 | 178729967 | $115,428,670 | 115428670 | $63,301,297 | 63301297 |
| 2015 | $147,889,666 | 147889666 | $125,458,486 | 125458486 | $22,431,180 | 22431180 |
| 2016 | $95,846,667 | 95846667 | $130,290,910 | 130290910 | $-34,444,243 | -34444243 |
| 2017 | $100,041,000 | 100041000 | $136,573,000 | 136573000 | $-36,532,000 | -36532000 |
| 2018 | $95,270,301 | 95270301 | $135,681,867 | 135681867 | $-40,411,566 | -40411566 |
| 2019 | $140,611,962 | 140611962 | $134,776,225 | 134776225 | $5,835,737 | 5835737 |
| 2020 | $177,129,962 | 177129962 | $138,321,485 | 138321485 | $38,808,477 | 38808477 |
| 2021 | $191,091,962 | 191091962 | $129,635,938 | 129635938 | $61,456,024 | 61456024 |
| 2022 | $228,976,529 | 228976529 | $147,002,411 | 147002411 | $81,974,118 | 81974118 |
| 2023 | $242,776,106 | 242776106 | $158,155,877 | 158155877 | $84,620,229 | 84620229 |
| 2024 | $221,985,285 | 221985285 | $133,074,721 | 133074721 | $88,910,564 | 88910564 |
| 2025 | $221,274,285 | 221274285 | $94,180,059 | 94180059 | $127,094,226 | 127094226 |
| 2026 | $159,882,618 | 159882618 | $74,818,461 | 74818461 | $85,064,157 | 85064157 |
| 2027 | $121,382,618 | 121382618 | $56,972,319 | 56972319 | $64,410,299 | 64410299 |
| 2028 | $79,382,618 | 79382618 | $45,437,759 | 45437759 | $33,944,859 | 33944859 |
| 2029 | $75,382,618 | 75382618 | $37,269,628 | 37269628 | $38,112,990 | 38112990 |
| 2030 | $75,382,618 | 75382618 | $39,665,769 | 39665769 | $35,716,849 | 35716849 |
| 2031 | $50,811,189 | 50811189 | $38,360,152 | 38360152 | $12,451,037 | 12451037 |
| 2032 | $27,272,727 | 27272727 | $47,925,459 | 47925459 | $-20,652,732 | -20652732 |
| 2033 | $27,272,730 | 27272730 | $43,068,924 | 43068924 | $-15,796,194 | -15796194 |
|
 2013 Philadelphia Phillies