| Player | Player Sort | Pos | Salary | Salary Sort | Pct | Pct Sort | WARP | WARP Sort | WARP/$M | WARP/$M Sort | $/WARP | $/WARP Sort | Current Status |
|---|
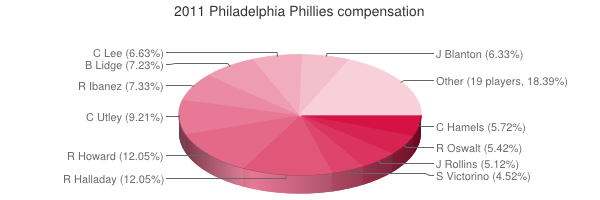
 Ryan Howard
 |
Howard Ryan |
1B |
$20,000,000 |
20000000 |
12.05% |
12.05 |
2.58 |
2.576 |
0.13 |
0.1288 |
$7,763,975 |
7763975.1552795 |
|
 Roy Halladay
 |
Halladay Roy |
RP |
$20,000,000 |
20000000 |
12.05% |
12.05 |
7.50 |
7.49912 |
0.37 |
0.374956 |
$2,666,980 |
2666979.5922722 |
|
 Chase Utley
 |
Utley Chase |
2B |
$15,285,714 |
15285714 |
9.21% |
9.21 |
3.52 |
3.5153 |
0.23 |
0.22997290149482 |
$4,348,338 |
4348338.4063949 |
|
 Raul Ibanez
 |
Ibanez Raul |
LF |
$12,166,667 |
12166667 |
7.33% |
7.33 |
0.65 |
0.64517 |
0.05 |
0.053027669780064 |
$18,858,079 |
18858079.26593 |
|
 Brad Lidge
 |
Lidge Brad |
RP |
$12,000,000 |
12000000 |
7.23% |
7.23 |
0.43 |
0.429571 |
0.04 |
0.035797583333333 |
$27,934,847 |
27934846.626053 |
|
 Cliff Lee
 |
Lee Cliff |
RP |
$11,000,000 |
11000000 |
6.63% |
6.63 |
7.48 |
7.48421 |
0.68 |
0.68038272727273 |
$1,469,761 |
1469761.0034994 |
|
 Joe Blanton
 |
Blanton Joe |
RP |
$10,500,000 |
10500000 |
6.33% |
6.33 |
0.92 |
0.91712 |
0.09 |
0.087344761904762 |
$11,448,883 |
11448883.46127 |
|
 Cole Hamels
 |
Hamels Cole |
RP |
$9,500,000 |
9500000 |
5.72% |
5.72 |
6.37 |
6.3724 |
0.67 |
0.67077894736842 |
$1,490,804 |
1490804.0926496 |
|
 Roy Oswalt
 |
Oswalt Roy |
RP |
$9,000,000 |
9000000 |
5.42% |
5.42 |
1.77 |
1.77127 |
0.20 |
0.19680777777778 |
$5,081,100 |
5081100.0016937 |
|
 Jimmy Rollins
 |
Rollins Jimmy |
SS |
$8,500,000 |
8500000 |
5.12% |
5.12 |
4.44 |
4.43829 |
0.52 |
0.52215176470588 |
$1,915,152 |
1915152.0067413 |
|
 Shane Victorino
 |
Victorino Shane |
CF |
$7,500,000 |
7500000 |
4.52% |
4.52 |
5.76 |
5.76227 |
0.77 |
0.76830266666667 |
$1,301,570 |
1301570.3880589 |
|
 Placido Polanco
 |
Polanco Placido |
3B |
$5,416,667 |
5416667 |
3.26% |
3.26 |
2.69 |
2.68719 |
0.50 |
0.49609658485559 |
$2,015,737 |
2015736.5128629 |
|
 Ryan Madson
 |
Madson Ryan |
RP |
$4,833,333 |
4833333 |
2.91% |
2.91 |
1.03 |
1.02881 |
0.21 |
0.21285725605912 |
$4,697,984 |
4697984.0786929 |
|
 Carlos Ruiz
 |
Ruiz Carlos |
C |
$2,750,000 |
2750000 |
1.66% |
1.66 |
2.28 |
2.27501 |
0.83 |
0.82727636363636 |
$1,208,786 |
1208785.8954466 |
|
 Danys Baez
 |
Baez Danys |
RP |
$2,750,000 |
2750000 |
1.66% |
1.66 |
-0.27 |
-0.272661 |
— |
0 |
— |
0 |
|
 Jose Contreras
 |
Contreras Jose |
RP |
$2,500,000 |
2500000 |
1.51% |
1.51 |
0.02 |
0.0203899 |
0.01 |
0.00815596 |
$122,609,723 |
122609723.44151 |
|
 Kyle Kendrick
 |
Kendrick Kyle |
RP |
$2,450,000 |
2450000 |
1.48% |
1.48 |
0.47 |
0.471606 |
0.19 |
0.19249224489796 |
$5,195,014 |
5195014.4824281 |
|
 Brian Schneider
 |
Schneider Brian |
C |
$1,625,000 |
1625000 |
0.98% |
0.98 |
-0.18 |
-0.184345 |
— |
0 |
— |
0 |
|
 Ross Gload
 |
Gload Ross |
PH |
$1,600,000 |
1600000 |
0.96% |
0.96 |
-0.22 |
-0.224007 |
— |
0 |
— |
0 |
|
 J.C. Romero
 |
Romero J.C. |
RP |
$1,350,000 |
1350000 |
0.81% |
0.81 |
-0.23 |
-0.232206 |
— |
0 |
— |
0 |
|
 Ben Francisco
 |
Francisco Ben |
RF |
$1,175,000 |
1175000 |
0.71% |
0.71 |
0.50 |
0.498538 |
0.42 |
0.42428765957447 |
$2,356,892 |
2356891.5508948 |
|
 Pete Orr
 |
Orr Pete |
2B |
$600,000 |
600000 |
0.36% |
0.36 |
-0.26 |
-0.262311 |
— |
0 |
— |
0 |
|
 Wilson Valdez
 |
Valdez Wilson |
2B |
$560,000 |
560000 |
0.34% |
0.34 |
-0.04 |
-0.0363073 |
— |
0 |
— |
0 |
|
 David Herndon
 |
Herndon David |
RP |
$425,000 |
425000 |
0.26% |
0.26 |
-0.30 |
-0.295759 |
— |
0 |
— |
0 |
|
 Antonio Bastardo
 |
Bastardo Antonio |
RP |
$419,000 |
419000 |
0.25% |
0.25 |
1.31 |
1.31443 |
3.14 |
3.1370644391408 |
$318,769 |
318769.352495 |
|
 John Mayberry Jr.
 |
Mayberry John |
PH |
$414,000 |
414000 |
0.25% |
0.25 |
2.18 |
2.17962 |
5.26 |
5.2647826086957 |
$189,941 |
189941.36592617 |
|
 Domonic Brown
 |
Brown Domonic |
RF |
$414,000 |
414000 |
0.25% |
0.25 |
0.36 |
0.361248 |
0.87 |
0.87257971014493 |
$1,146,027 |
1146027.1060324 |
|
 Michael Martinez
 |
Martinez Michael |
3B |
$414,000 |
414000 |
0.25% |
0.25 |
0.01 |
0.0128616 |
0.03 |
0.031066666666667 |
$32,188,841 |
32188841.201717 |
|
 Brian Bocock
 |
Bocock Brian |
DNP |
$414,000 |
414000 |
0.25% |
0.25 |
— |
0.00 |
— |
0 |
— |
0 |
|
 Brian Schlitter
 |
Schlitter Brian |
DNP |
$414,000 |
414000 |
0.25% |
0.25 |
— |
0.00 |
— |
0 |
— |
0 |
|
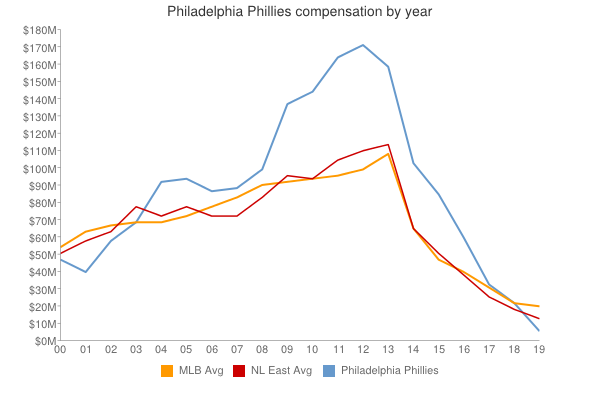
| Year | Phillies payroll |
PR Sort |
Avg payroll |
AvgPR Sort |
Diff |
Diff Sort |
|---|
| 2000 | $47,011,333 | 47011333 | $56,164,089 | 56164089 | $-9,152,756 | -9152756 |
| 2001 | $41,911,166 | 41911166 | $65,991,638 | 65991638 | $-24,080,472 | -24080472 |
| 2002 | $58,167,499 | 58167499 | $68,244,471 | 68244471 | $-10,076,972 | -10076972 |
| 2003 | $69,676,667 | 69676667 | $71,318,479 | 71318479 | $-1,641,812 | -1641812 |
| 2004 | $92,444,167 | 92444167 | $70,466,961 | 70466961 | $21,977,206 | 21977206 |
| 2005 | $95,625,667 | 95625667 | $73,264,780 | 73264780 | $22,360,887 | 22360887 |
| 2006 | $87,642,000 | 87642000 | $79,051,754 | 79051754 | $8,590,246 | 8590246 |
| 2007 | $89,839,547 | 89839547 | $83,931,138 | 83931138 | $5,908,409 | 5908409 |
| 2008 | $96,735,047 | 96735047 | $90,812,373 | 90812373 | $5,922,674 | 5922674 |
| 2009 | $131,087,380 | 131087380 | $91,093,211 | 91093211 | $39,994,169 | 39994169 |
| 2010 | $144,178,379 | 144178379 | $93,373,681 | 93373681 | $50,804,698 | 50804698 |
| 2011 | $165,976,381 | 165976381 | $96,102,034 | 96102034 | $69,874,347 | 69874347 |
| 2012 | $172,093,283 | 172093283 | $100,657,138 | 100657138 | $71,436,145 | 71436145 |
| 2013 | $160,585,714 | 160585714 | $109,024,990 | 109024990 | $51,560,724 | 51560724 |
| 2014 | $178,729,967 | 178729967 | $117,828,782 | 117828782 | $60,901,185 | 60901185 |
| 2015 | $147,889,666 | 147889666 | $127,404,244 | 127404244 | $20,485,422 | 20485422 |
| 2016 | $95,846,667 | 95846667 | $132,219,407 | 132219407 | $-36,372,740 | -36372740 |
| 2017 | $100,041,000 | 100041000 | $137,302,894 | 137302894 | $-37,261,894 | -37261894 |
| 2018 | $95,270,301 | 95270301 | $136,929,168 | 136929168 | $-41,658,867 | -41658867 |
| 2019 | $140,611,962 | 140611962 | $136,944,257 | 136944257 | $3,667,705 | 3667705 |
| 2020 | $177,129,962 | 177129962 | $140,677,788 | 140677788 | $36,452,174 | 36452174 |
| 2021 | $191,091,962 | 191091962 | $132,162,631 | 132162631 | $58,929,331 | 58929331 |
| 2022 | $228,976,529 | 228976529 | $149,374,046 | 149374046 | $79,602,483 | 79602483 |
| 2023 | $242,776,106 | 242776106 | $160,460,390 | 160460390 | $82,315,716 | 82315716 |
| 2024 | $221,985,285 | 221985285 | $135,504,022 | 135504022 | $86,481,263 | 86481263 |
| 2025 | $221,274,285 | 221274285 | $96,417,302 | 96417302 | $124,856,983 | 124856983 |
| 2026 | $159,882,618 | 159882618 | $76,694,120 | 76694120 | $83,188,498 | 83188498 |
| 2027 | $121,382,618 | 121382618 | $58,935,617 | 58935617 | $62,447,001 | 62447001 |
| 2028 | $79,382,618 | 79382618 | $45,437,759 | 45437759 | $33,944,859 | 33944859 |
| 2029 | $75,382,618 | 75382618 | $37,269,628 | 37269628 | $38,112,990 | 38112990 |
| 2030 | $75,382,618 | 75382618 | $39,665,769 | 39665769 | $35,716,849 | 35716849 |
| 2031 | $50,811,189 | 50811189 | $38,360,152 | 38360152 | $12,451,037 | 12451037 |
| 2032 | $27,272,727 | 27272727 | $47,925,459 | 47925459 | $-20,652,732 | -20652732 |
| 2033 | $27,272,730 | 27272730 | $43,068,924 | 43068924 | $-15,796,194 | -15796194 |
|
 2011 Philadelphia Phillies