| Player | Player Sort | Pos | Salary | Salary Sort | Pct | Pct Sort | WARP | WARP Sort | WARP/$M | WARP/$M Sort | $/WARP | $/WARP Sort | Current Status |
|---|
 Pat Burrell
 |
Burrell Pat |
LF |
$13,250,000 |
13250000 |
14.75% |
14.75 |
2.08 |
2.0819 |
0.16 |
0.15712452830189 |
$6,364,379 |
6364378.6925405 |
|
 Freddy Garcia
 |
Garcia Freddy |
RP |
$10,000,000 |
10000000 |
11.13% |
11.13 |
0.40 |
0.404176 |
0.04 |
0.0404176 |
$24,741,697 |
24741696.686592 |
|
 Jimmy Rollins
 |
Rollins Jimmy |
SS |
$8,000,000 |
8000000 |
8.90% |
8.90 |
6.53 |
6.53143 |
0.82 |
0.81642875 |
$1,224,847 |
1224846.6262365 |
|
 Jon Lieber
 |
Lieber Jon |
RP |
$7,500,000 |
7500000 |
8.35% |
8.35 |
1.02 |
1.02484 |
0.14 |
0.13664533333333 |
$7,318,216 |
7318215.5263261 |
|
 Adam Eaton
 |
Eaton Adam |
RP |
$7,208,333 |
7208333 |
8.02% |
8.02 |
-4.20 |
-4.20178 |
— |
0 |
— |
0 |
|
 Tom Gordon
 |
Gordon Tom |
RP |
$7,000,000 |
7000000 |
7.79% |
7.79 |
0.25 |
0.252234 |
0.04 |
0.036033428571429 |
$27,752,008 |
27752008.056011 |
|
 Jamie Moyer
 |
Moyer Jamie |
RP |
$6,500,000 |
6500000 |
7.24% |
7.24 |
-1.34 |
-1.3367 |
— |
0 |
— |
0 |
|
 Brett Myers
 |
Myers Brett |
RP |
$5,000,000 |
5000000 |
5.57% |
5.57 |
2.36 |
2.35837 |
0.47 |
0.471674 |
$2,120,108 |
2120108.3799404 |
|
 Chase Utley
 |
Utley Chase |
2B |
$4,785,714 |
4785714 |
5.33% |
5.33 |
6.83 |
6.8302 |
1.43 |
1.4272060553556 |
$700,670 |
700669.67292319 |
|
 Aaron Rowand
 |
Rowand Aaron |
CF |
$4,350,000 |
4350000 |
4.84% |
4.84 |
4.40 |
4.39548 |
1.01 |
1.0104551724138 |
$989,653 |
989653.0071801 |
|
 Rod Barajas
 |
Barajas Rod |
C |
$3,000,000 |
3000000 |
3.34% |
3.34 |
0.63 |
0.631323 |
0.21 |
0.210441 |
$4,751,926 |
4751925.7178972 |
|
 Jose Mesa
 |
Mesa Jose |
RP |
$2,500,000 |
2500000 |
2.78% |
2.78 |
-0.97 |
-0.968572 |
— |
0 |
— |
0 |
|
 Wes Helms
 |
Helms Wes |
3B |
$2,050,000 |
2050000 |
2.28% |
2.28 |
-0.43 |
-0.429821 |
— |
0 |
— |
0 |
|
 Ryan Madson
 |
Madson Ryan |
RP |
$1,100,000 |
1100000 |
1.22% |
1.22 |
0.62 |
0.623989 |
0.57 |
0.56726272727273 |
$1,762,852 |
1762851.5887299 |
|
 Ryan Howard
 |
Howard Ryan |
1B |
$900,000 |
900000 |
1.00% |
1.00 |
3.92 |
3.92244 |
4.36 |
4.3582666666667 |
$229,449 |
229449.01642855 |
|
 Jayson Werth
 |
Werth Jayson |
RF |
$850,000 |
850000 |
0.95% |
0.95 |
3.11 |
3.10721 |
3.66 |
3.6555411764706 |
$273,557 |
273557.3070375 |
|
 Geoff Geary
 |
Geary Geoff |
RP |
$837,500 |
837500 |
0.93% |
0.93 |
-0.37 |
-0.372181 |
— |
0 |
— |
0 |
FA/2011 |
 Shane Victorino
 |
Victorino Shane |
RF |
$410,000 |
410000 |
0.46% |
0.46 |
3.31 |
3.30659 |
8.06 |
8.0648536585366 |
$123,995 |
123994.81036355 |
|
 Cole Hamels
 |
Hamels Cole |
RP |
$400,000 |
400000 |
0.45% |
0.45 |
5.18 |
5.18419 |
12.96 |
12.960475 |
$77,158 |
77157.665903449 |
|
 Chris Coste
 |
Coste Chris |
C |
$385,000 |
385000 |
0.43% |
0.43 |
0.42 |
0.421595 |
1.10 |
1.0950519480519 |
$913,199 |
913198.68594267 |
|
 Clay Condrey
 |
Condrey Clay |
RP |
$385,000 |
385000 |
0.43% |
0.43 |
-0.20 |
-0.200719 |
— |
0 |
— |
0 |
|
 Greg Dobbs
 |
Dobbs Greg |
3B |
$385,000 |
385000 |
0.43% |
0.43 |
0.62 |
0.619881 |
1.61 |
1.6100805194805 |
$621,087 |
621086.95055987 |
|
 Fabio Castro
 |
Castro Fabio |
RP |
$383,000 |
383000 |
0.43% |
0.43 |
0.02 |
0.0178958 |
0.05 |
0.046725326370757 |
$21,401,670 |
21401669.665508 |
|
 Carlos Ruiz
 |
Ruiz Carlos |
C |
$380,000 |
380000 |
0.42% |
0.42 |
0.07 |
0.0653901 |
0.17 |
0.17207921052632 |
$5,811,277 |
5811277.2422737 |
|
 Michael Bourn
 |
Bourn Michael |
LF |
$380,000 |
380000 |
0.42% |
0.42 |
0.09 |
0.0863105 |
0.23 |
0.22713289473684 |
$4,402,709 |
4402708.8245347 |
|
 Antonio Alfonseca
 |
Alfonseca Antonio |
RP |
$380,000 |
380000 |
0.42% |
0.42 |
-1.15 |
-1.14906 |
— |
0 |
— |
0 |
|
 Zack Segovia
 |
Segovia Zack |
RP |
$380,000 |
380000 |
0.42% |
0.42 |
-0.06 |
-0.061882 |
— |
0 |
— |
0 |
|
 Scott Mathieson
 |
Mathieson Scott |
DNP |
$380,000 |
380000 |
0.42% |
0.42 |
— |
0.00 |
— |
0 |
— |
0 |
|
 Matt Smith
 |
Smith Matt |
RP |
$380,000 |
380000 |
0.42% |
0.42 |
-0.17 |
-0.169949 |
— |
0 |
— |
0 |
|
 Joe Bisenius
 |
Bisenius Joe |
RP |
$380,000 |
380000 |
0.42% |
0.42 |
0.03 |
0.0322637 |
0.08 |
0.084904473684211 |
$11,777,942 |
11777942.393464 |
|
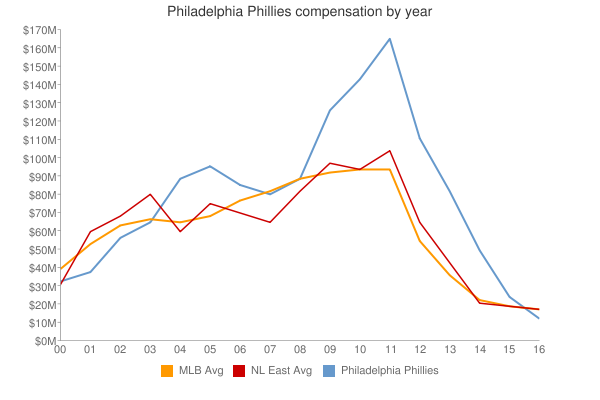
| Year | Phillies payroll |
PR Sort |
Avg payroll |
AvgPR Sort |
Diff |
Diff Sort |
|---|
| 2000 | $47,011,333 | 47011333 | $56,164,089 | 56164089 | $-9,152,756 | -9152756 |
| 2001 | $41,911,166 | 41911166 | $65,991,638 | 65991638 | $-24,080,472 | -24080472 |
| 2002 | $58,167,499 | 58167499 | $68,244,471 | 68244471 | $-10,076,972 | -10076972 |
| 2003 | $69,676,667 | 69676667 | $71,318,479 | 71318479 | $-1,641,812 | -1641812 |
| 2004 | $92,444,167 | 92444167 | $70,466,961 | 70466961 | $21,977,206 | 21977206 |
| 2005 | $95,625,667 | 95625667 | $73,264,780 | 73264780 | $22,360,887 | 22360887 |
| 2006 | $87,642,000 | 87642000 | $79,051,754 | 79051754 | $8,590,246 | 8590246 |
| 2007 | $89,839,547 | 89839547 | $83,931,138 | 83931138 | $5,908,409 | 5908409 |
| 2008 | $96,735,047 | 96735047 | $90,812,373 | 90812373 | $5,922,674 | 5922674 |
| 2009 | $131,087,380 | 131087380 | $91,093,211 | 91093211 | $39,994,169 | 39994169 |
| 2010 | $144,178,379 | 144178379 | $93,373,681 | 93373681 | $50,804,698 | 50804698 |
| 2011 | $165,976,381 | 165976381 | $96,102,034 | 96102034 | $69,874,347 | 69874347 |
| 2012 | $172,093,283 | 172093283 | $100,657,138 | 100657138 | $71,436,145 | 71436145 |
| 2013 | $160,585,714 | 160585714 | $109,024,990 | 109024990 | $51,560,724 | 51560724 |
| 2014 | $178,729,967 | 178729967 | $117,828,782 | 117828782 | $60,901,185 | 60901185 |
| 2015 | $147,889,666 | 147889666 | $127,404,244 | 127404244 | $20,485,422 | 20485422 |
| 2016 | $95,846,667 | 95846667 | $132,219,407 | 132219407 | $-36,372,740 | -36372740 |
| 2017 | $100,041,000 | 100041000 | $137,302,894 | 137302894 | $-37,261,894 | -37261894 |
| 2018 | $95,270,301 | 95270301 | $136,929,168 | 136929168 | $-41,658,867 | -41658867 |
| 2019 | $140,611,962 | 140611962 | $136,944,257 | 136944257 | $3,667,705 | 3667705 |
| 2020 | $177,129,962 | 177129962 | $140,677,788 | 140677788 | $36,452,174 | 36452174 |
| 2021 | $191,091,962 | 191091962 | $132,162,631 | 132162631 | $58,929,331 | 58929331 |
| 2022 | $228,976,529 | 228976529 | $149,374,046 | 149374046 | $79,602,483 | 79602483 |
| 2023 | $242,776,106 | 242776106 | $160,460,390 | 160460390 | $82,315,716 | 82315716 |
| 2024 | $221,985,285 | 221985285 | $135,504,022 | 135504022 | $86,481,263 | 86481263 |
| 2025 | $221,274,285 | 221274285 | $96,417,302 | 96417302 | $124,856,983 | 124856983 |
| 2026 | $159,882,618 | 159882618 | $76,694,120 | 76694120 | $83,188,498 | 83188498 |
| 2027 | $121,382,618 | 121382618 | $58,935,617 | 58935617 | $62,447,001 | 62447001 |
| 2028 | $79,382,618 | 79382618 | $45,437,759 | 45437759 | $33,944,859 | 33944859 |
| 2029 | $75,382,618 | 75382618 | $37,269,628 | 37269628 | $38,112,990 | 38112990 |
| 2030 | $75,382,618 | 75382618 | $39,665,769 | 39665769 | $35,716,849 | 35716849 |
| 2031 | $50,811,189 | 50811189 | $38,360,152 | 38360152 | $12,451,037 | 12451037 |
| 2032 | $27,272,727 | 27272727 | $47,925,459 | 47925459 | $-20,652,732 | -20652732 |
| 2033 | $27,272,730 | 27272730 | $43,068,924 | 43068924 | $-15,796,194 | -15796194 |
|
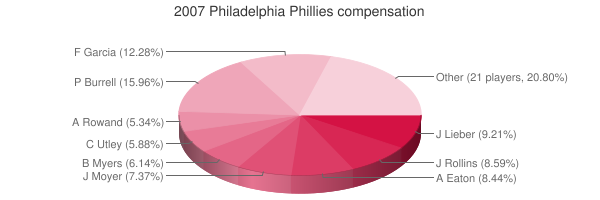
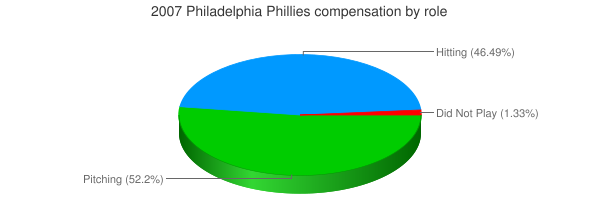
 2007 Philadelphia Phillies