| Player | Player Sort | Pos | Salary | Salary Sort | Pct | Pct Sort | WARP | WARP Sort | WARP/$M | WARP/$M Sort | $/WARP | $/WARP Sort | Current Status |
|---|
 Jim Thome
 |
Thome Jim |
1B |
$12,166,667 |
12166667 |
13.16% |
13.16 |
3.24 |
3.24345 |
0.27 |
0.26658492420315 |
$3,751,150 |
3751149.8558634 |
|
 Kevin Millwood
 |
Millwood Kevin |
RP |
$11,000,000 |
11000000 |
11.90% |
11.90 |
3.26 |
3.26254 |
0.30 |
0.29659454545455 |
$3,371,606 |
3371606.1718784 |
|
 Bobby Abreu
 |
Abreu Bobby |
RF |
$10,600,000 |
10600000 |
11.47% |
11.47 |
6.31 |
6.31044 |
0.60 |
0.59532452830189 |
$1,679,756 |
1679756.0867388 |
|
 Eric Milton
 |
Milton Eric |
RP |
$9,000,000 |
9000000 |
9.74% |
9.74 |
-0.00 |
-0.00035046 |
— |
0 |
— |
0 |
|
 Billy Wagner
 |
Wagner Billy |
RP |
$8,000,000 |
8000000 |
8.65% |
8.65 |
1.66 |
1.65823 |
0.21 |
0.20727875 |
$4,824,421 |
4824421.2202167 |
|
 Mike Lieberthal
 |
Lieberthal Mike |
C |
$7,500,000 |
7500000 |
8.11% |
8.11 |
2.20 |
2.20087 |
0.29 |
0.29344933333333 |
$3,407,743 |
3407743.3015126 |
|
 Randy Wolf
 |
Wolf Randy |
RP |
$4,375,000 |
4375000 |
4.73% |
4.73 |
1.95 |
1.94576 |
0.44 |
0.44474514285714 |
$2,248,479 |
2248478.7435244 |
|
 Pat Burrell
 |
Burrell Pat |
LF |
$4,250,000 |
4250000 |
4.60% |
4.60 |
2.43 |
2.42817 |
0.57 |
0.57133411764706 |
$1,750,289 |
1750289.3125275 |
|
 David Bell
 |
Bell David |
3B |
$4,200,000 |
4200000 |
4.54% |
4.54 |
4.61 |
4.61121 |
1.10 |
1.0979071428571 |
$910,824 |
910823.84016343 |
|
 Placido Polanco
 |
Polanco Placido |
2B |
$3,950,000 |
3950000 |
4.27% |
4.27 |
2.02 |
2.01711 |
0.51 |
0.51066075949367 |
$1,958,247 |
1958247.1952447 |
|
 Rheal Cormier
 |
Cormier Rheal |
RP |
$3,000,000 |
3000000 |
3.25% |
3.25 |
0.66 |
0.661123 |
0.22 |
0.22037433333333 |
$4,537,734 |
4537733.5231114 |
|
 Tim Worrell
 |
Worrell Tim |
RP |
$2,750,000 |
2750000 |
2.97% |
2.97 |
1.40 |
1.40418 |
0.51 |
0.51061090909091 |
$1,958,438 |
1958438.3768463 |
|
 Vicente Padilla
 |
Padilla Vicente |
RP |
$2,600,000 |
2600000 |
2.81% |
2.81 |
2.09 |
2.09374 |
0.81 |
0.80528461538462 |
$1,241,797 |
1241796.9757467 |
|
 Jimmy Rollins
 |
Rollins Jimmy |
SS |
$2,425,000 |
2425000 |
2.62% |
2.62 |
4.49 |
4.49433 |
1.85 |
1.8533319587629 |
$539,569 |
539568.74550823 |
|
 Ricky Ledee
 |
Ledee Ricky |
PH |
$1,225,000 |
1225000 |
1.33% |
1.33 |
1.01 |
1.00748 |
0.82 |
0.82243265306122 |
$1,215,905 |
1215905.0303728 |
|
 Todd Pratt
 |
Pratt Todd |
C |
$875,000 |
875000 |
0.95% |
0.95 |
0.91 |
0.908551 |
1.04 |
1.038344 |
$963,072 |
963071.96844206 |
|
 Roberto Hernandez
 |
Hernandez Roberto |
RP |
$750,000 |
750000 |
0.81% |
0.81 |
0.67 |
0.666498 |
0.89 |
0.888664 |
$1,125,285 |
1125284.6970283 |
|
 Tomas Perez
 |
Perez Tomas |
PH |
$700,000 |
700000 |
0.76% |
0.76 |
0.01 |
0.00813365 |
0.01 |
0.0116195 |
$86,062,223 |
86062222.98722 |
|
 Paul Abbott
 |
Abbott Paul |
RP |
$600,000 |
600000 |
0.65% |
0.65 |
-1.37 |
-1.3738 |
— |
0 |
— |
0 |
|
 Shawn Wooten
 |
Wooten Shawn |
PH |
$575,000 |
575000 |
0.62% |
0.62 |
-0.58 |
-0.577572 |
— |
0 |
— |
0 |
|
 Doug Glanville
 |
Glanville Doug |
CF |
$550,000 |
550000 |
0.59% |
0.59 |
-0.45 |
-0.454913 |
— |
0 |
— |
0 |
|
 Brett Myers
 |
Myers Brett |
RP |
$362,500 |
362500 |
0.39% |
0.39 |
1.24 |
1.2355 |
3.41 |
3.408275862069 |
$293,403 |
293403.48037232 |
|
 Marlon Byrd
 |
Byrd Marlon |
CF |
$355,000 |
355000 |
0.38% |
0.38 |
-1.19 |
-1.18831 |
— |
0 |
— |
0 |
|
 Jason Michaels
 |
Michaels Jason |
CF |
$335,000 |
335000 |
0.36% |
0.36 |
1.65 |
1.64964 |
4.92 |
4.9242985074627 |
$203,075 |
203074.61021799 |
|
 Ryan Madson
 |
Madson Ryan |
RP |
$300,000 |
300000 |
0.32% |
0.32 |
1.56 |
1.56004 |
5.20 |
5.2001333333333 |
$192,303 |
192302.76146765 |
|
| Year | Phillies payroll |
PR Sort |
Avg payroll |
AvgPR Sort |
Diff |
Diff Sort |
|---|
| 2000 | $47,011,333 | 47011333 | $55,368,142 | 55368142 | $-8,356,809 | -8356809 |
| 2001 | $41,911,166 | 41911166 | $64,937,084 | 64937084 | $-23,025,918 | -23025918 |
| 2002 | $58,167,499 | 58167499 | $67,238,672 | 67238672 | $-9,071,173 | -9071173 |
| 2003 | $69,676,667 | 69676667 | $70,654,480 | 70654480 | $-977,813 | -977813 |
| 2004 | $92,444,167 | 92444167 | $69,466,729 | 69466729 | $22,977,438 | 22977438 |
| 2005 | $95,625,667 | 95625667 | $74,114,841 | 74114841 | $21,510,826 | 21510826 |
| 2006 | $87,642,000 | 87642000 | $79,621,815 | 79621815 | $8,020,185 | 8020185 |
| 2007 | $89,839,547 | 89839547 | $85,537,470 | 85537470 | $4,302,077 | 4302077 |
| 2008 | $96,735,047 | 96735047 | $92,003,799 | 92003799 | $4,731,248 | 4731248 |
| 2009 | $131,087,380 | 131087380 | $92,169,598 | 92169598 | $38,917,782 | 38917782 |
| 2010 | $144,178,379 | 144178379 | $94,342,601 | 94342601 | $49,835,778 | 49835778 |
| 2011 | $165,976,381 | 165976381 | $96,974,710 | 96974710 | $69,001,671 | 69001671 |
| 2012 | $172,093,283 | 172093283 | $100,947,217 | 100947217 | $71,146,066 | 71146066 |
| 2013 | $160,585,714 | 160585714 | $108,586,966 | 108586966 | $51,998,748 | 51998748 |
| 2014 | $178,729,967 | 178729967 | $117,131,361 | 117131361 | $61,598,606 | 61598606 |
| 2015 | $147,889,666 | 147889666 | $126,168,161 | 126168161 | $21,721,505 | 21721505 |
| 2016 | $95,846,667 | 95846667 | $131,756,569 | 131756569 | $-35,909,902 | -35909902 |
| 2017 | $100,041,000 | 100041000 | $136,337,445 | 136337445 | $-36,296,445 | -36296445 |
| 2018 | $95,270,301 | 95270301 | $135,360,600 | 135360600 | $-40,090,299 | -40090299 |
| 2019 | $140,611,962 | 140611962 | $134,792,134 | 134792134 | $5,819,828 | 5819828 |
| 2020 | $177,129,962 | 177129962 | $139,496,467 | 139496467 | $37,633,495 | 37633495 |
| 2021 | $191,091,962 | 191091962 | $130,712,288 | 130712288 | $60,379,674 | 60379674 |
| 2022 | $228,976,529 | 228976529 | $149,802,695 | 149802695 | $79,173,834 | 79173834 |
| 2023 | $242,776,106 | 242776106 | $161,692,345 | 161692345 | $81,083,761 | 81083761 |
| 2024 | $221,985,285 | 221985285 | $136,306,249 | 136306249 | $85,679,036 | 85679036 |
| 2025 | $221,274,285 | 221274285 | $98,329,527 | 98329527 | $122,944,758 | 122944758 |
| 2026 | $159,882,618 | 159882618 | $78,039,273 | 78039273 | $81,843,345 | 81843345 |
| 2027 | $121,382,618 | 121382618 | $60,919,343 | 60919343 | $60,463,275 | 60463275 |
| 2028 | $79,382,618 | 79382618 | $46,901,712 | 46901712 | $32,480,906 | 32480906 |
| 2029 | $75,382,618 | 75382618 | $38,597,944 | 38597944 | $36,784,674 | 36784674 |
| 2030 | $75,382,618 | 75382618 | $41,447,579 | 41447579 | $33,935,039 | 33935039 |
| 2031 | $50,811,189 | 50811189 | $38,360,152 | 38360152 | $12,451,037 | 12451037 |
| 2032 | $27,272,727 | 27272727 | $47,925,459 | 47925459 | $-20,652,732 | -20652732 |
| 2033 | $27,272,730 | 27272730 | $43,068,924 | 43068924 | $-15,796,194 | -15796194 |
|
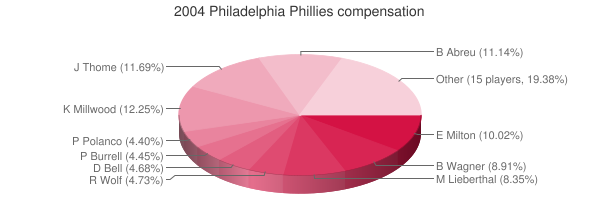
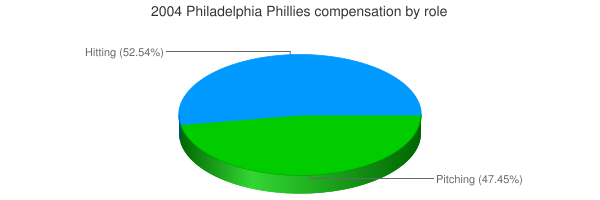
 2004 Philadelphia Phillies