| Player | Player Sort | Pos | Salary | Salary Sort | Pct | Pct Sort | WARP | WARP Sort | WARP/$M | WARP/$M Sort | $/WARP | $/WARP Sort | Current Status |
|---|
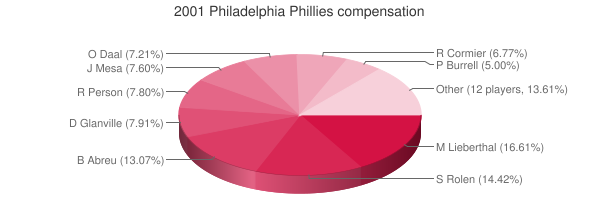
 Mike Lieberthal
 |
Lieberthal Mike |
C |
$6,333,333 |
6333333 |
15.11% |
15.11 |
0.18 |
0.182428 |
0.03 |
0.028804422568654 |
$34,716,891 |
34716891.047427 |
|
 Scott Rolen
 |
Rolen Scott |
3B |
$5,500,000 |
5500000 |
13.12% |
13.12 |
5.99 |
5.99344 |
1.09 |
1.0897163636364 |
$917,670 |
917669.9858512 |
|
 Bobby Abreu
 |
Abreu Bobby |
RF |
$4,983,333 |
4983333 |
11.89% |
11.89 |
5.27 |
5.27431 |
1.06 |
1.0583900373505 |
$944,831 |
944831.26702829 |
|
 Doug Glanville
 |
Glanville Doug |
CF |
$3,016,667 |
3016667 |
7.20% |
7.20 |
2.77 |
2.77123 |
0.92 |
0.91863967749838 |
$1,088,566 |
1088566.0879826 |
|
 Robert Person
 |
Person Robert |
RP |
$2,975,000 |
2975000 |
7.10% |
7.10 |
4.14 |
4.13576 |
1.39 |
1.3901714285714 |
$719,336 |
719335.74482078 |
|
 Jose Mesa
 |
Mesa Jose |
RP |
$2,900,000 |
2900000 |
6.92% |
6.92 |
1.09 |
1.08862 |
0.38 |
0.37538620689655 |
$2,663,923 |
2663923.1320387 |
|
 Omar Daal
 |
Daal Omar |
RP |
$2,750,000 |
2750000 |
6.56% |
6.56 |
2.21 |
2.21093 |
0.80 |
0.80397454545455 |
$1,243,820 |
1243820.4737373 |
|
 Rheal Cormier
 |
Cormier Rheal |
RP |
$2,583,333 |
2583333 |
6.16% |
6.16 |
0.41 |
0.411505 |
0.16 |
0.15929227861836 |
$6,277,768 |
6277768.192367 |
|
 Pat Burrell
 |
Burrell Pat |
LF |
$1,905,000 |
1905000 |
4.55% |
4.55 |
2.54 |
2.53603 |
1.33 |
1.331249343832 |
$751,174 |
751174.07917099 |
|
 Ricky Bottalico
 |
Bottalico Ricky |
RP |
$1,500,000 |
1500000 |
3.58% |
3.58 |
0.74 |
0.737181 |
0.49 |
0.491454 |
$2,034,778 |
2034778.4329764 |
|
 Wayne Gomes
 |
Gomes Wayne |
RP |
$925,000 |
925000 |
2.21% |
2.21 |
0.46 |
0.464646 |
0.50 |
0.50232 |
$1,990,763 |
1990762.8603281 |
|
 Brian L. Hunter
 |
Hunter Brian L. |
PH |
$900,000 |
900000 |
2.15% |
2.15 |
0.97 |
0.970184 |
1.08 |
1.0779822222222 |
$927,659 |
927659.08322545 |
|
 Travis Lee
 |
Lee Travis |
1B |
$800,000 |
800000 |
1.91% |
1.91 |
1.27 |
1.26661 |
1.58 |
1.5832625 |
$631,607 |
631607.20348016 |
|
 Chris Brock
 |
Brock Chris |
RP |
$750,000 |
750000 |
1.79% |
1.79 |
0.68 |
0.681335 |
0.91 |
0.90844666666667 |
$1,100,780 |
1100780.0861544 |
|
 Kevin Jordan
 |
Jordan Kevin |
PH |
$700,000 |
700000 |
1.67% |
1.67 |
-0.25 |
-0.248868 |
— |
0 |
— |
0 |
|
 Paul Byrd
 |
Byrd Paul |
RP |
$600,000 |
600000 |
1.43% |
1.43 |
0.27 |
0.265345 |
0.44 |
0.44224166666667 |
$2,261,207 |
2261207.1077277 |
|
 Rob Ducey
 |
Ducey Rob |
PH |
$500,000 |
500000 |
1.19% |
1.19 |
0.17 |
0.174214 |
0.35 |
0.348428 |
$2,870,033 |
2870033.4071889 |
|
 Randy Wolf
 |
Wolf Randy |
RP |
$365,000 |
365000 |
0.87% |
0.87 |
4.72 |
4.71729 |
12.92 |
12.924082191781 |
$77,375 |
77374.933489355 |
|
 Bruce Chen
 |
Chen Bruce |
RP |
$300,000 |
300000 |
0.72% |
0.72 |
0.59 |
0.592417 |
1.97 |
1.9747233333333 |
$506,400 |
506400.05266561 |
|
 Marlon Anderson
 |
Anderson Marlon |
2B |
$280,000 |
280000 |
0.67% |
0.67 |
4.42 |
4.41536 |
15.77 |
15.769142857143 |
$63,415 |
63414.987679374 |
|
 Tomas Perez
 |
Perez Tomas |
2B |
$280,000 |
280000 |
0.67% |
0.67 |
0.48 |
0.477548 |
1.71 |
1.7055285714286 |
$586,328 |
586328.49472723 |
|
 Gary Bennett
 |
Bennett Gary |
C |
$237,500 |
237500 |
0.57% |
0.57 |
-0.11 |
-0.111304 |
— |
0 |
— |
0 |
|
 Vicente Padilla
 |
Padilla Vicente |
RP |
$225,000 |
225000 |
0.54% |
0.54 |
0.91 |
0.908405 |
4.04 |
4.0373555555556 |
$247,687 |
247686.87975077 |
|
 Pablo Ozuna
 |
Ozuna Pablo |
DNP |
$202,000 |
202000 |
0.48% |
0.48 |
— |
0.00 |
— |
0 |
— |
0 |
|
 Eddie Oropesa
 |
Oropesa Eddie |
RP |
$200,000 |
200000 |
0.48% |
0.48 |
0.04 |
0.0368779 |
0.18 |
0.1843895 |
$5,423,302 |
5423302.3030053 |
|
 Jimmy Rollins
 |
Rollins Jimmy |
SS |
$200,000 |
200000 |
0.48% |
0.48 |
2.30 |
2.3028 |
11.51 |
11.514 |
$86,851 |
86850.790342192 |
|
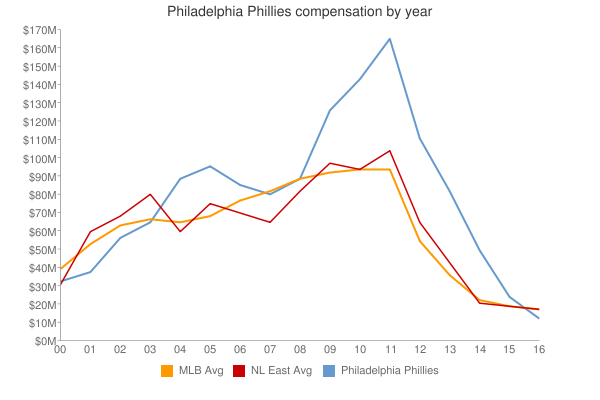
| Year | Phillies payroll |
PR Sort |
Avg payroll |
AvgPR Sort |
Diff |
Diff Sort |
|---|
| 2000 | $47,011,333 | 47011333 | $55,368,142 | 55368142 | $-8,356,809 | -8356809 |
| 2001 | $41,911,166 | 41911166 | $64,937,084 | 64937084 | $-23,025,918 | -23025918 |
| 2002 | $58,167,499 | 58167499 | $67,238,672 | 67238672 | $-9,071,173 | -9071173 |
| 2003 | $69,676,667 | 69676667 | $70,654,480 | 70654480 | $-977,813 | -977813 |
| 2004 | $92,444,167 | 92444167 | $69,466,729 | 69466729 | $22,977,438 | 22977438 |
| 2005 | $95,625,667 | 95625667 | $74,114,841 | 74114841 | $21,510,826 | 21510826 |
| 2006 | $87,642,000 | 87642000 | $79,621,815 | 79621815 | $8,020,185 | 8020185 |
| 2007 | $89,839,547 | 89839547 | $85,537,470 | 85537470 | $4,302,077 | 4302077 |
| 2008 | $96,735,047 | 96735047 | $92,003,799 | 92003799 | $4,731,248 | 4731248 |
| 2009 | $131,087,380 | 131087380 | $92,169,598 | 92169598 | $38,917,782 | 38917782 |
| 2010 | $144,178,379 | 144178379 | $94,342,601 | 94342601 | $49,835,778 | 49835778 |
| 2011 | $165,976,381 | 165976381 | $96,974,710 | 96974710 | $69,001,671 | 69001671 |
| 2012 | $172,093,283 | 172093283 | $100,947,217 | 100947217 | $71,146,066 | 71146066 |
| 2013 | $160,585,714 | 160585714 | $108,586,966 | 108586966 | $51,998,748 | 51998748 |
| 2014 | $178,729,967 | 178729967 | $117,131,361 | 117131361 | $61,598,606 | 61598606 |
| 2015 | $147,889,666 | 147889666 | $126,168,161 | 126168161 | $21,721,505 | 21721505 |
| 2016 | $95,846,667 | 95846667 | $131,756,569 | 131756569 | $-35,909,902 | -35909902 |
| 2017 | $100,041,000 | 100041000 | $136,337,445 | 136337445 | $-36,296,445 | -36296445 |
| 2018 | $95,270,301 | 95270301 | $135,360,600 | 135360600 | $-40,090,299 | -40090299 |
| 2019 | $140,611,962 | 140611962 | $134,792,134 | 134792134 | $5,819,828 | 5819828 |
| 2020 | $177,129,962 | 177129962 | $139,496,467 | 139496467 | $37,633,495 | 37633495 |
| 2021 | $191,091,962 | 191091962 | $130,712,288 | 130712288 | $60,379,674 | 60379674 |
| 2022 | $228,976,529 | 228976529 | $149,802,695 | 149802695 | $79,173,834 | 79173834 |
| 2023 | $242,776,106 | 242776106 | $161,692,345 | 161692345 | $81,083,761 | 81083761 |
| 2024 | $221,985,285 | 221985285 | $136,306,249 | 136306249 | $85,679,036 | 85679036 |
| 2025 | $221,274,285 | 221274285 | $98,329,527 | 98329527 | $122,944,758 | 122944758 |
| 2026 | $159,882,618 | 159882618 | $78,039,273 | 78039273 | $81,843,345 | 81843345 |
| 2027 | $121,382,618 | 121382618 | $60,919,343 | 60919343 | $60,463,275 | 60463275 |
| 2028 | $79,382,618 | 79382618 | $46,901,712 | 46901712 | $32,480,906 | 32480906 |
| 2029 | $75,382,618 | 75382618 | $38,597,944 | 38597944 | $36,784,674 | 36784674 |
| 2030 | $75,382,618 | 75382618 | $41,447,579 | 41447579 | $33,935,039 | 33935039 |
| 2031 | $50,811,189 | 50811189 | $38,360,152 | 38360152 | $12,451,037 | 12451037 |
| 2032 | $27,272,727 | 27272727 | $47,925,459 | 47925459 | $-20,652,732 | -20652732 |
| 2033 | $27,272,730 | 27272730 | $43,068,924 | 43068924 | $-15,796,194 | -15796194 |
|
 2001 Philadelphia Phillies