| Player | Player Sort | Pos | Salary | Salary Sort | Pct | Pct Sort | WARP | WARP Sort | WARP/$M | WARP/$M Sort | $/WARP | $/WARP Sort | Current Status |
|---|
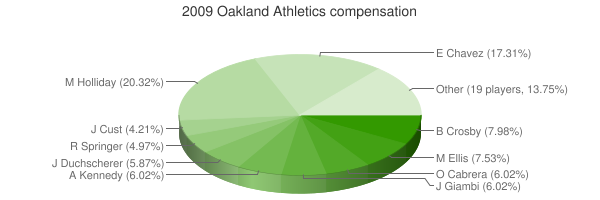
 Matt Holliday
 |
Holliday Matt |
LF |
$13,500,000 |
13500000 |
21.62% |
21.62 |
2.63 |
2.63075 |
0.19 |
0.19487037037037 |
$5,131,616 |
5131616.4591846 |
|
 Eric Chavez
 |
Chavez Eric |
3B |
$11,500,000 |
11500000 |
18.42% |
18.42 |
-0.46 |
-0.462641 |
— |
0 |
— |
0 |
|
 Bobby Crosby
 |
Crosby Bobby |
1B |
$5,300,000 |
5300000 |
8.49% |
8.49 |
-0.33 |
-0.330519 |
— |
0 |
— |
0 |
|
 Mark Ellis
 |
Ellis Mark |
2B |
$5,000,000 |
5000000 |
8.01% |
8.01 |
0.39 |
0.39061 |
0.08 |
0.078122 |
$12,800,492 |
12800491.538875 |
|
 Jason Giambi
 |
Giambi Jason |
1B |
$4,000,000 |
4000000 |
6.41% |
6.41 |
0.08 |
0.0764062 |
0.02 |
0.01910155 |
$52,351,773 |
52351772.500137 |
|
 Orlando Cabrera
 |
Cabrera Orlando |
SS |
$4,000,000 |
4000000 |
6.41% |
6.41 |
-0.25 |
-0.250476 |
— |
0 |
— |
0 |
|
 Justin Duchscherer
 |
Duchscherer Justin |
DNP |
$3,900,000 |
3900000 |
6.25% |
6.25 |
— |
0.00 |
— |
0 |
— |
0 |
|
 Russ Springer
 |
Springer Russ |
RP |
$3,300,000 |
3300000 |
5.29% |
5.29 |
0.42 |
0.419661 |
0.13 |
0.12717 |
$7,863,490 |
7863489.8167807 |
|
 Jack Cust
 |
Cust Jack |
DH |
$2,800,000 |
2800000 |
4.48% |
4.48 |
0.90 |
0.904733 |
0.32 |
0.32311892857143 |
$3,094,836 |
3094835.713962 |
|
 Michael Wuertz
 |
Wuertz Michael |
RP |
$1,100,000 |
1100000 |
1.76% |
1.76 |
2.66 |
2.66119 |
2.42 |
2.4192636363636 |
$413,349 |
413348.91533487 |
|
 Nomar Garciaparra
 |
Garciaparra Nomar |
PH |
$1,000,000 |
1000000 |
1.60% |
1.60 |
-0.01 |
-0.00700794 |
— |
0 |
— |
0 |
|
 Dallas McPherson
 |
McPherson Dallas |
DNP |
$500,000 |
500000 |
0.80% |
0.80 |
— |
0.00 |
— |
0 |
— |
0 |
|
 Edwar Ramirez
 |
Ramirez Edwar |
DNP |
$422,450 |
422450 |
0.68% |
0.68 |
— |
0.00 |
— |
0 |
— |
0 |
|
 Craig Breslow
 |
Breslow Craig |
RP |
$422,000 |
422000 |
0.68% |
0.68 |
0.64 |
0.641641 |
1.52 |
1.5204763033175 |
$657,689 |
657688.64520815 |
|
 Santiago Casilla
 |
Casilla Santiago |
RP |
$420,000 |
420000 |
0.67% |
0.67 |
-0.31 |
-0.309696 |
— |
0 |
— |
0 |
|
 Travis Buck
 |
Buck Travis |
RF |
$410,000 |
410000 |
0.66% |
0.66 |
-0.25 |
-0.254722 |
— |
0 |
— |
0 |
|
 Kurt Suzuki
 |
Suzuki Kurt |
C |
$410,000 |
410000 |
0.66% |
0.66 |
1.43 |
1.43138 |
3.49 |
3.4911707317073 |
$286,437 |
286436.86512317 |
|
 Ryan Sweeney
 |
Sweeney Ryan |
RF |
$410,000 |
410000 |
0.66% |
0.66 |
3.50 |
3.5002 |
8.54 |
8.5370731707317 |
$117,136 |
117136.16364779 |
|
 Rajai Davis
 |
Davis Rajai |
CF |
$410,000 |
410000 |
0.66% |
0.66 |
2.73 |
2.73352 |
6.67 |
6.6671219512195 |
$149,990 |
149989.7567971 |
|
 Dallas Braden
 |
Braden Dallas |
RP |
$410,000 |
410000 |
0.66% |
0.66 |
0.74 |
0.737864 |
1.80 |
1.7996682926829 |
$555,658 |
555657.95322715 |
|
 Joey Devine
 |
Devine Joey |
DNP |
$410,000 |
410000 |
0.66% |
0.66 |
— |
0.00 |
— |
0 |
— |
0 |
|
 Brad Ziegler
 |
Ziegler Brad |
RP |
$405,000 |
405000 |
0.65% |
0.65 |
0.65 |
0.646193 |
1.60 |
1.5955382716049 |
$626,748 |
626747.7363574 |
|
 Jerry Blevins
 |
Blevins Jerry |
RP |
$405,000 |
405000 |
0.65% |
0.65 |
0.52 |
0.516648 |
1.28 |
1.2756740740741 |
$783,899 |
783899.28926464 |
|
 Andrew Bailey
 |
Bailey Andrew |
RP |
$400,000 |
400000 |
0.64% |
0.64 |
2.66 |
2.65621 |
6.64 |
6.640525 |
$150,591 |
150590.50300993 |
|
 Josh Outman
 |
Outman Josh |
RP |
$400,000 |
400000 |
0.64% |
0.64 |
1.06 |
1.05912 |
2.65 |
2.6478 |
$377,672 |
377672.02960949 |
|
 Brett Anderson
 |
Anderson Brett |
RP |
$400,000 |
400000 |
0.64% |
0.64 |
4.22 |
4.22129 |
10.55 |
10.553225 |
$94,758 |
94757.763622021 |
|
 Trevor Cahill
 |
Cahill Trevor |
RP |
$400,000 |
400000 |
0.64% |
0.64 |
-1.07 |
-1.07108 |
— |
0 |
— |
0 |
|
 Landon Powell
 |
Powell Landon |
C |
$400,000 |
400000 |
0.64% |
0.64 |
-0.10 |
-0.102625 |
— |
0 |
— |
0 |
|
| Year | Athletics payroll |
PR Sort |
Avg payroll |
AvgPR Sort |
Diff |
Diff Sort |
|---|
| 1979 | $21,000 | 21000 | $48,000 | 48000 | $-27,000 | -27000 |
| 1981 | $185,000 | 185000 | $92,500 | 92500 | $92,500 | 92500 |
| 1982 | $535,000 | 535000 | $267,500 | 267500 | $267,500 | 267500 |
| 1983 | $800,000 | 800000 | $400,000 | 400000 | $400,000 | 400000 |
| 1984 | $950,000 | 950000 | $260,000 | 260000 | $690,000 | 690000 |
| 1987 | $72,500 | 72500 | $589,500 | 589500 | $-517,000 | -517000 |
| 1988 | $250,000 | 250000 | $732,083 | 732083 | $-482,083 | -482083 |
| 1989 | $455,000 | 455000 | $862,714 | 862714 | $-407,714 | -407714 |
| 1990 | $3,750,000 | 3750000 | $1,203,571 | 1203571 | $2,546,429 | 2546429 |
| 1991 | $6,100,000 | 6100000 | $1,884,642 | 1884642 | $4,215,358 | 4215358 |
| 1992 | $5,950,000 | 5950000 | $2,356,071 | 2356071 | $3,593,929 | 3593929 |
| 1993 | $7,250,000 | 7250000 | $3,410,000 | 3410000 | $3,840,000 | 3840000 |
| 1994 | $7,800,000 | 7800000 | $3,911,904 | 3911904 | $3,888,096 | 3888096 |
| 1995 | $10,700,000 | 10700000 | $5,208,333 | 5208333 | $5,491,667 | 5491667 |
| 1996 | $7,000,000 | 7000000 | $4,583,416 | 4583416 | $2,416,584 | 2416584 |
| 1997 | $7,100,000 | 7100000 | $4,892,222 | 4892222 | $2,207,778 | 2207778 |
| 1998 | $9,433,333 | 9433333 | $6,661,904 | 6661904 | $2,771,429 | 2771429 |
| 1999 | $8,833,333 | 8833333 | $7,867,823 | 7867823 | $965,510 | 965510 |
| 2000 | $30,906,333 | 30906333 | $56,164,089 | 56164089 | $-25,257,756 | -25257756 |
| 2001 | $33,404,750 | 33404750 | $65,991,638 | 65991638 | $-32,586,888 | -32586888 |
| 2002 | $40,004,167 | 40004167 | $68,244,471 | 68244471 | $-28,240,304 | -28240304 |
| 2003 | $49,644,266 | 49644266 | $71,318,479 | 71318479 | $-21,674,213 | -21674213 |
| 2004 | $59,150,667 | 59150667 | $70,466,961 | 70466961 | $-11,316,294 | -11316294 |
| 2005 | $53,960,500 | 53960500 | $73,264,780 | 73264780 | $-19,304,280 | -19304280 |
| 2006 | $64,615,625 | 64615625 | $79,051,754 | 79051754 | $-14,436,129 | -14436129 |
| 2007 | $80,777,050 | 80777050 | $83,931,138 | 83931138 | $-3,154,088 | -3154088 |
| 2008 | $46,325,000 | 46325000 | $90,812,373 | 90812373 | $-44,487,373 | -44487373 |
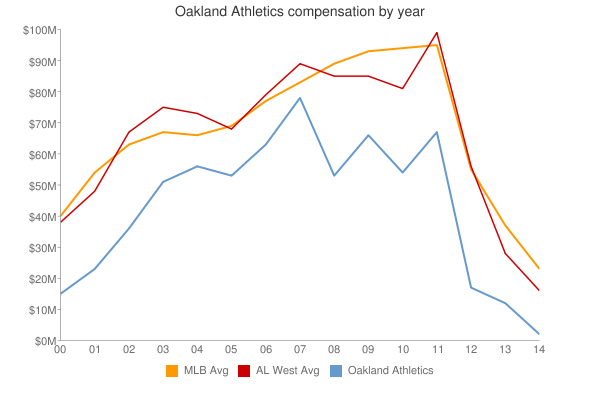
| 2009 | $62,434,450 | 62434450 | $91,093,211 | 91093211 | $-28,658,761 | -28658761 |
| 2010 | $54,457,400 | 54457400 | $93,373,681 | 93373681 | $-38,916,281 | -38916281 |
| 2011 | $67,354,000 | 67354000 | $96,102,034 | 96102034 | $-28,748,034 | -28748034 |
| 2012 | $53,957,500 | 53957500 | $100,657,138 | 100657138 | $-46,699,638 | -46699638 |
| 2013 | $61,964,500 | 61964500 | $109,024,990 | 109024990 | $-47,060,490 | -47060490 |
| 2014 | $82,445,900 | 82445900 | $117,828,782 | 117828782 | $-35,382,882 | -35382882 |
| 2015 | $82,389,167 | 82389167 | $127,404,244 | 127404244 | $-45,015,077 | -45015077 |
| 2016 | $86,806,234 | 86806234 | $132,219,407 | 132219407 | $-45,413,173 | -45413173 |
| 2017 | $81,738,333 | 81738333 | $137,302,894 | 137302894 | $-55,564,561 | -55564561 |
| 2018 | $65,985,833 | 65985833 | $136,929,168 | 136929168 | $-70,943,335 | -70943335 |
| 2019 | $89,135,833 | 89135833 | $136,944,257 | 136944257 | $-47,808,424 | -47808424 |
| 2020 | $96,582,433 | 96582433 | $140,677,788 | 140677788 | $-44,095,355 | -44095355 |
| 2021 | $84,413,334 | 84413334 | $132,162,631 | 132162631 | $-47,749,297 | -47749297 |
| 2022 | $48,943,334 | 48943334 | $149,374,046 | 149374046 | $-100,430,712 | -100430712 |
| 2023 | $56,395,000 | 56395000 | $160,460,390 | 160460390 | $-104,065,390 | -104065390 |
| 2024 | $43,255,000 | 43255000 | $135,504,022 | 135504022 | $-92,249,022 | -92249022 |
| 2025 | $15,000,000 | 15000000 | $96,417,302 | 96417302 | $-81,417,302 | -81417302 |
| 2026 | $15,000,000 | 15000000 | $76,694,120 | 76694120 | $-61,694,120 | -61694120 |
| 2027 | $15,000,000 | 15000000 | $58,935,617 | 58935617 | $-43,935,617 | -43935617 |
| 2028 | $15,000,000 | 15000000 | $45,437,759 | 45437759 | $-30,437,759 | -30437759 |
|
 2009 Oakland Athletics