| Player | Player Sort | Pos | Salary | Salary Sort | Pct | Pct Sort | WARP | WARP Sort | WARP/$M | WARP/$M Sort | $/WARP | $/WARP Sort | Current Status |
|---|
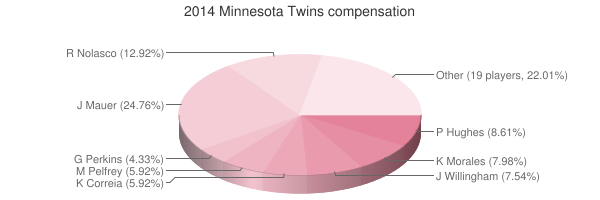
 Joe Mauer
 |
Mauer Joe |
1B |
$23,000,000 |
23000000 |
24.76% |
24.76 |
1.51 |
1.51233 |
0.07 |
0.06575347826087 |
$15,208,321 |
15208320.935246 |
|
 Ricky Nolasco
 |
Nolasco Ricky |
RP |
$12,000,000 |
12000000 |
12.92% |
12.92 |
-1.79 |
-1.78921 |
— |
0 |
— |
0 |
|
 Phil Hughes
 |
Hughes Phil |
RP |
$8,000,000 |
8000000 |
8.61% |
8.61 |
3.43 |
3.42706 |
0.43 |
0.4283825 |
$2,334,362 |
2334362.3980905 |
|
 Kendrys Morales
 |
Morales Kendrys |
DH |
$7,409,836 |
7409836 |
7.98% |
7.98 |
-0.57 |
-0.573907 |
— |
0 |
— |
0 |
|
 Josh Willingham
 |
Willingham Josh |
LF |
$7,000,000 |
7000000 |
7.54% |
7.54 |
1.53 |
1.53407 |
0.22 |
0.21915285714286 |
$4,563,025 |
4563025.1553058 |
|
 Mike Pelfrey
 |
Pelfrey Mike |
RP |
$5,500,000 |
5500000 |
5.92% |
5.92 |
-0.99 |
-0.989937 |
— |
0 |
— |
0 |
|
 Kevin Correia
 |
Correia Kevin |
RP |
$5,500,000 |
5500000 |
5.92% |
5.92 |
-1.28 |
-1.2754 |
— |
0 |
— |
0 |
|
 Glen Perkins
 |
Perkins Glen |
RP |
$4,025,000 |
4025000 |
4.33% |
4.33 |
0.26 |
0.259126 |
0.06 |
0.064379130434783 |
$15,532,984 |
15532983.953752 |
|
 Jared Burton
 |
Burton Jared |
RP |
$3,250,000 |
3250000 |
3.50% |
3.50 |
-0.80 |
-0.796388 |
— |
0 |
— |
0 |
|
 Kurt Suzuki
 |
Suzuki Kurt |
C |
$2,750,000 |
2750000 |
2.96% |
2.96 |
0.66 |
0.660083 |
0.24 |
0.24003018181818 |
$4,166,143 |
4166142.7426551 |
|
 Trevor Plouffe
 |
Plouffe Trevor |
3B |
$2,350,000 |
2350000 |
2.53% |
2.53 |
2.67 |
2.66957 |
1.14 |
1.1359872340426 |
$880,292 |
880291.58253951 |
|
 Jason Kubel
 |
Kubel Jason |
LF |
$2,000,000 |
2000000 |
2.15% |
2.15 |
-0.67 |
-0.672768 |
— |
0 |
— |
0 |
|
 Brian Duensing
 |
Duensing Brian |
RP |
$2,000,000 |
2000000 |
2.15% |
2.15 |
-1.01 |
-1.01323 |
— |
0 |
— |
0 |
|
 Jason Bartlett
 |
Bartlett Jason |
LF |
$1,000,000 |
1000000 |
1.08% |
1.08 |
-0.02 |
-0.0227617 |
— |
0 |
— |
0 |
|
 Anthony Swarzak
 |
Swarzak Anthony |
RP |
$935,000 |
935000 |
1.01% |
1.01 |
-1.35 |
-1.3479 |
— |
0 |
— |
0 |
|
 Brian Dozier
 |
Dozier Brian |
2B |
$540,000 |
540000 |
0.58% |
0.58 |
4.62 |
4.61736 |
8.55 |
8.5506666666667 |
$116,950 |
116949.94542336 |
|
 Casey Fien
 |
Fien Casey |
RP |
$530,000 |
530000 |
0.57% |
0.57 |
0.44 |
0.439676 |
0.83 |
0.82957735849057 |
$1,205,433 |
1205433.0916402 |
|
 Samuel Deduno
 |
Deduno Samuel |
RP |
$520,000 |
520000 |
0.56% |
0.56 |
-1.35 |
-1.34926 |
— |
0 |
— |
0 |
|
 Pedro Florimón
 |
Florimon Pedro |
SS |
$517,500 |
517500 |
0.56% |
0.56 |
-0.42 |
-0.41879 |
— |
0 |
— |
0 |
|
 Oswaldo Arcia
 |
Arcia Oswaldo |
RF |
$512,500 |
512500 |
0.55% |
0.55 |
0.95 |
0.951487 |
1.86 |
1.85656 |
$538,631 |
538630.58559917 |
|
 Caleb Thielbar
 |
Thielbar Caleb |
RP |
$510,000 |
510000 |
0.55% |
0.55 |
-0.61 |
-0.61275 |
— |
0 |
— |
0 |
|
 Aaron Hicks
 |
Hicks Aaron |
CF |
$507,500 |
507500 |
0.55% |
0.55 |
0.98 |
0.980061 |
1.93 |
1.931154679803 |
$517,825 |
517824.9108984 |
|
 Eduardo Escobar
 |
Escobar Eduardo |
SS |
$507,500 |
507500 |
0.55% |
0.55 |
0.60 |
0.596833 |
1.18 |
1.1760256157635 |
$850,322 |
850321.6142539 |
|
 Chris Colabello
 |
Colabello Chris |
1B |
$505,000 |
505000 |
0.54% |
0.54 |
-0.13 |
-0.130461 |
— |
0 |
— |
0 |
|
 Michael Tonkin
 |
Tonkin Michael |
RP |
$502,500 |
502500 |
0.54% |
0.54 |
-0.01 |
-0.00955153 |
— |
0 |
— |
0 |
|
 Kyle Gibson
 |
Gibson Kyle |
RP |
$502,500 |
502500 |
0.54% |
0.54 |
1.23 |
1.23084 |
2.45 |
2.4494328358209 |
$408,258 |
408257.77517793 |
|
 Josmil Pinto
 |
Pinto Josmil |
C |
$500,000 |
500000 |
0.54% |
0.54 |
-0.43 |
-0.431869 |
— |
0 |
— |
0 |
|
| Year | Twins payroll |
PR Sort |
Avg payroll |
AvgPR Sort |
Diff |
Diff Sort |
|---|
| 1984 | $50,000 | 50000 | $260,000 | 260000 | $-210,000 | -210000 |
| 1985 | $130,000 | 130000 | $437,500 | 437500 | $-307,500 | -307500 |
| 1986 | $265,000 | 265000 | $552,000 | 552000 | $-287,000 | -287000 |
| 1987 | $465,000 | 465000 | $589,500 | 589500 | $-124,500 | -124500 |
| 1988 | $1,210,000 | 1210000 | $732,083 | 732083 | $477,917 | 477917 |
| 1989 | $2,050,000 | 2050000 | $862,714 | 862714 | $1,187,286 | 1187286 |
| 1990 | $2,700,000 | 2700000 | $1,203,571 | 1203571 | $1,496,429 | 1496429 |
| 1991 | $3,000,000 | 3000000 | $1,884,642 | 1884642 | $1,115,358 | 1115358 |
| 1992 | $3,300,000 | 3300000 | $2,356,071 | 2356071 | $943,929 | 943929 |
| 1993 | $5,200,000 | 5200000 | $3,410,000 | 3410000 | $1,790,000 | 1790000 |
| 1994 | $5,200,000 | 5200000 | $3,911,904 | 3911904 | $1,288,096 | 1288096 |
| 1995 | $6,200,000 | 6200000 | $5,208,333 | 5208333 | $991,667 | 991667 |
| 1996 | $6,200,000 | 6200000 | $4,583,416 | 4583416 | $1,616,584 | 1616584 |
| 1997 | $7,200,000 | 7200000 | $4,892,222 | 4892222 | $2,307,778 | 2307778 |
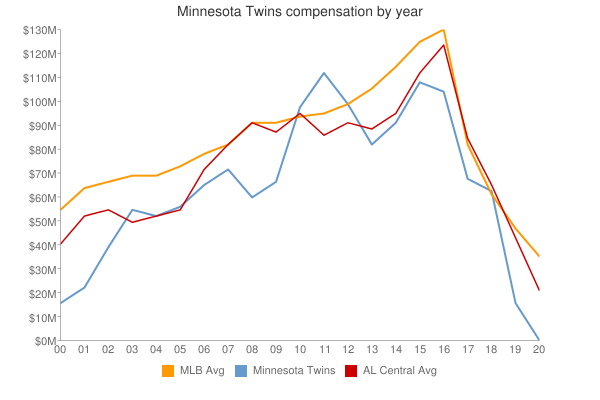
| 2000 | $16,542,500 | 16542500 | $57,491,092 | 57491092 | $-40,948,592 | -40948592 |
| 2001 | $23,930,000 | 23930000 | $67,120,750 | 67120750 | $-43,190,750 | -43190750 |
| 2002 | $39,950,000 | 39950000 | $69,204,705 | 69204705 | $-29,254,705 | -29254705 |
| 2003 | $55,275,000 | 55275000 | $72,156,639 | 72156639 | $-16,881,639 | -16881639 |
| 2004 | $53,815,000 | 53815000 | $71,426,357 | 71426357 | $-17,611,357 | -17611357 |
| 2005 | $56,556,000 | 56556000 | $73,628,169 | 73628169 | $-17,072,169 | -17072169 |
| 2006 | $65,024,500 | 65024500 | $81,192,832 | 81192832 | $-16,168,332 | -16168332 |
| 2007 | $72,189,500 | 72189500 | $85,747,487 | 85747487 | $-13,557,987 | -13557987 |
| 2008 | $61,442,667 | 61442667 | $93,079,041 | 93079041 | $-31,636,374 | -31636374 |
| 2009 | $67,027,267 | 67027267 | $92,957,049 | 92957049 | $-25,929,782 | -25929782 |
| 2010 | $98,159,167 | 98159167 | $94,957,956 | 94957956 | $3,201,211 | 3201211 |
| 2011 | $113,237,000 | 113237000 | $97,426,414 | 97426414 | $15,810,586 | 15810586 |
| 2012 | $100,431,000 | 100431000 | $100,689,500 | 100689500 | $-258,500 | -258500 |
| 2013 | $82,010,000 | 82010000 | $106,658,387 | 106658387 | $-24,648,387 | -24648387 |
| 2014 | $92,874,836 | 92874836 | $115,428,670 | 115428670 | $-22,553,834 | -22553834 |
| 2015 | $108,262,500 | 108262500 | $125,458,486 | 125458486 | $-17,195,986 | -17195986 |
| 2016 | $105,333,700 | 105333700 | $130,290,910 | 130290910 | $-24,957,210 | -24957210 |
| 2017 | $108,102,500 | 108102500 | $136,573,000 | 136573000 | $-28,470,500 | -28470500 |
| 2018 | $128,713,226 | 128713226 | $135,681,867 | 135681867 | $-6,968,641 | -6968641 |
| 2019 | $119,651,933 | 119651933 | $134,776,225 | 134776225 | $-15,124,292 | -15124292 |
| 2020 | $131,799,311 | 131799311 | $138,321,485 | 138321485 | $-6,522,174 | -6522174 |
| 2021 | $131,678,167 | 131678167 | $129,635,938 | 129635938 | $2,042,229 | 2042229 |
| 2022 | $141,020,356 | 141020356 | $147,002,411 | 147002411 | $-5,982,055 | -5982055 |
| 2023 | $154,063,740 | 154063740 | $158,155,877 | 158155877 | $-4,092,137 | -4092137 |
| 2024 | $108,346,590 | 108346590 | $133,074,721 | 133074721 | $-24,728,131 | -24728131 |
| 2025 | $96,981,190 | 96981190 | $94,180,059 | 94180059 | $2,801,131 | 2801131 |
| 2026 | $70,726,190 | 70726190 | $74,818,461 | 74818461 | $-4,092,271 | -4092271 |
| 2027 | $68,726,190 | 68726190 | $56,972,319 | 56972319 | $11,753,871 | 11753871 |
| 2028 | $46,476,190 | 46476190 | $45,437,759 | 45437759 | $1,038,431 | 1038431 |
|
 2014 Minnesota Twins