| Player | Player Sort | Pos | Salary | Salary Sort | Pct | Pct Sort | WARP | WARP Sort | WARP/$M | WARP/$M Sort | $/WARP | $/WARP Sort | Current Status |
|---|
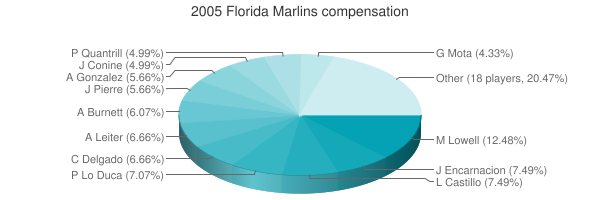
 Mike Lowell
 |
Lowell Mike |
3B |
$7,500,000 |
7500000 |
11.96% |
11.96 |
-0.03 |
-0.026736 |
— |
0 |
— |
0 |
FA/2011 |
 Al Leiter
 |
Leiter Al |
RP |
$7,000,000 |
7000000 |
11.16% |
11.16 |
-1.50 |
-1.49558 |
— |
0 |
— |
0 |
|
 Juan Encarnacion
 |
Encarnacion Juan |
RF |
$4,500,000 |
4500000 |
7.17% |
7.17 |
1.73 |
1.72848 |
0.38 |
0.38410666666667 |
$2,603,443 |
2603443.48792 |
|
 Luis Castillo
 |
Castillo Luis |
2B |
$4,500,000 |
4500000 |
7.17% |
7.17 |
2.94 |
2.93661 |
0.65 |
0.65258 |
$1,532,379 |
1532379.1719023 |
|
 Paul Lo Duca
 |
Lo Duca Paul |
C |
$4,250,000 |
4250000 |
6.78% |
6.78 |
1.37 |
1.37177 |
0.32 |
0.32276941176471 |
$3,098,187 |
3098187.013858 |
|
 Carlos Delgado
 |
Delgado Carlos |
1B |
$4,000,000 |
4000000 |
6.38% |
6.38 |
4.90 |
4.90405 |
1.23 |
1.2260125 |
$815,652 |
815652.36896035 |
|
 A.J. Burnett
 |
Burnett A.J. |
RP |
$3,650,000 |
3650000 |
5.82% |
5.82 |
6.54 |
6.53873 |
1.79 |
1.7914328767123 |
$558,212 |
558212.37457427 |
|
 Alex Gonzalez
 |
Gonzalez Alex |
SS |
$3,400,000 |
3400000 |
5.42% |
5.42 |
0.97 |
0.968909 |
0.28 |
0.28497323529412 |
$3,509,101 |
3509101.4739258 |
|
 Juan Pierre
 |
Pierre Juan |
CF |
$3,400,000 |
3400000 |
5.42% |
5.42 |
1.11 |
1.11372 |
0.33 |
0.32756470588235 |
$3,052,832 |
3052831.95058 |
|
 Jeff Conine
 |
Conine Jeff |
1B |
$3,000,000 |
3000000 |
4.78% |
4.78 |
1.63 |
1.63236 |
0.54 |
0.54412 |
$1,837,830 |
1837829.8904653 |
|
 Paul Quantrill
 |
Quantrill Paul |
RP |
$3,000,000 |
3000000 |
4.78% |
4.78 |
-0.01 |
-0.0100336 |
— |
0 |
— |
0 |
|
 Guillermo Mota
 |
Mota Guillermo |
RP |
$2,600,000 |
2600000 |
4.14% |
4.14 |
0.45 |
0.447757 |
0.17 |
0.17221423076923 |
$5,806,721 |
5806721.0562872 |
|
 Josh Beckett
 |
Beckett Josh |
RP |
$2,400,000 |
2400000 |
3.83% |
3.83 |
5.95 |
5.94916 |
2.48 |
2.4788166666667 |
$403,418 |
403418.29770926 |
|
 Ismael Valdez
 |
Valdez Ismael |
RP |
$1,500,000 |
1500000 |
2.39% |
2.39 |
-1.02 |
-1.01704 |
— |
0 |
— |
0 |
|
 Todd Jones
 |
Jones Todd |
RP |
$1,100,000 |
1100000 |
1.75% |
1.75 |
2.03 |
2.03442 |
1.85 |
1.8494727272727 |
$540,695 |
540694.64515685 |
|
 Jim Mecir
 |
Mecir Jim |
RP |
$1,100,000 |
1100000 |
1.75% |
1.75 |
0.30 |
0.296999 |
0.27 |
0.26999909090909 |
$3,703,716 |
3703716.1741285 |
|
 John Riedling
 |
Riedling John |
RP |
$750,000 |
750000 |
1.20% |
1.20 |
0.21 |
0.207318 |
0.28 |
0.276424 |
$3,617,631 |
3617630.8858855 |
|
 Damion Easley
 |
Easley Damion |
2B |
$750,000 |
750000 |
1.20% |
1.20 |
1.21 |
1.20675 |
1.61 |
1.609 |
$621,504 |
621504.03977626 |
|
 Matt Perisho
 |
Perisho Matt |
RP |
$475,000 |
475000 |
0.76% |
0.76 |
-0.05 |
-0.0464259 |
— |
0 |
— |
0 |
|
 Lenny Harris
 |
Harris Lenny |
PH |
$425,000 |
425000 |
0.68% |
0.68 |
0.35 |
0.347021 |
0.82 |
0.81652 |
$1,224,710 |
1224709.7437907 |
|
 Brian Moehler
 |
Moehler Brian |
RP |
$400,000 |
400000 |
0.64% |
0.64 |
0.65 |
0.64512 |
1.61 |
1.6128 |
$620,040 |
620039.68253968 |
|
 Dontrelle Willis
 |
Willis Dontrelle |
RP |
$378,500 |
378500 |
0.60% |
0.60 |
6.90 |
6.89803 |
18.22 |
18.22464993395 |
$54,871 |
54870.738457212 |
|
 Miguel Cabrera
 |
Cabrera Miguel |
LF |
$370,000 |
370000 |
0.59% |
0.59 |
6.66 |
6.66382 |
18.01 |
18.010324324324 |
$55,524 |
55523.708623582 |
|
 Nate Bump
 |
Bump Nate |
RP |
$360,000 |
360000 |
0.57% |
0.57 |
0.49 |
0.486094 |
1.35 |
1.3502611111111 |
$740,597 |
740597.49760334 |
|
 Tim Spooneybarger
 |
Spooneybarger Tim |
DNP |
$350,000 |
350000 |
0.56% |
0.56 |
— |
0.00 |
— |
0 |
— |
0 |
|
 Chad Bentz
 |
Bentz Chad |
RP |
$320,000 |
320000 |
0.51% |
0.51 |
-0.07 |
-0.0721109 |
— |
0 |
— |
0 |
|
 Matt Treanor
 |
Treanor Matt |
C |
$316,000 |
316000 |
0.50% |
0.50 |
-0.64 |
-0.638464 |
— |
0 |
— |
0 |
|
 Chris Aguila
 |
Aguila Chris |
LF |
$316,000 |
316000 |
0.50% |
0.50 |
-0.13 |
-0.125024 |
— |
0 |
— |
0 |
|
 Joe Dillon
 |
Dillon Joe |
PH |
$316,000 |
316000 |
0.50% |
0.50 |
-0.14 |
-0.141366 |
— |
0 |
— |
0 |
|
 Antonio Alfonseca
 |
Alfonseca Antonio |
RP |
$300,000 |
300000 |
0.48% |
0.48 |
0.05 |
0.0546654 |
0.18 |
0.182218 |
$5,487,932 |
5487932.0374496 |
|
| Year | Marlins payroll |
PR Sort |
Avg payroll |
AvgPR Sort |
Diff |
Diff Sort |
|---|
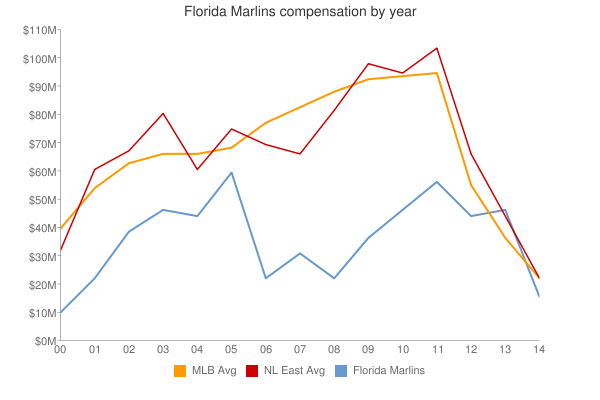
| 2000 | $19,008,000 | 19008000 | $56,164,089 | 56164089 | $-37,156,089 | -37156089 |
| 2001 | $34,376,500 | 34376500 | $65,991,638 | 65991638 | $-31,615,138 | -31615138 |
| 2002 | $41,357,917 | 41357917 | $68,244,471 | 68244471 | $-26,886,554 | -26886554 |
| 2003 | $47,850,000 | 47850000 | $71,318,479 | 71318479 | $-23,468,479 | -23468479 |
| 2004 | $43,603,875 | 43603875 | $70,466,961 | 70466961 | $-26,863,086 | -26863086 |
| 2005 | $62,726,500 | 62726500 | $73,264,780 | 73264780 | $-10,538,280 | -10538280 |
| 2006 | $16,960,500 | 16960500 | $79,051,754 | 79051754 | $-62,091,254 | -62091254 |
| 2007 | $31,257,000 | 31257000 | $83,931,138 | 83931138 | $-52,674,138 | -52674138 |
| 2008 | $25,079,000 | 25079000 | $90,812,373 | 90812373 | $-65,733,373 | -65733373 |
| 2009 | $37,041,926 | 37041926 | $91,093,211 | 91093211 | $-54,051,285 | -54051285 |
| 2010 | $47,429,719 | 47429719 | $93,373,681 | 93373681 | $-45,943,962 | -45943962 |
| 2011 | $57,695,000 | 57695000 | $96,102,034 | 96102034 | $-38,407,034 | -38407034 |
|
 2005 Florida Marlins