| Player | Player Sort | Pos | Salary | Salary Sort | Pct | Pct Sort | WARP | WARP Sort | WARP/$M | WARP/$M Sort | $/WARP | $/WARP Sort | Current Status |
|---|
 Todd Helton
 |
Helton Todd |
1B |
$10,600,000 |
10600000 |
12.88% |
12.88 |
3.17 |
3.17071 |
0.30 |
0.29912358490566 |
$3,343,100 |
3343099.8104525 |
|
 Aaron Cook
 |
Cook Aaron |
RP |
$10,083,333 |
10083333 |
12.25% |
12.25 |
-1.37 |
-1.3696 |
— |
0 |
— |
0 |
|
 Jorge De La Rosa
 |
De La Rosa Jorge |
RP |
$10,000,000 |
10000000 |
12.15% |
12.15 |
1.42 |
1.42179 |
0.14 |
0.142179 |
$7,033,387 |
7033387.490417 |
|
 Huston Street
 |
Street Huston |
RP |
$7,300,000 |
7300000 |
8.87% |
8.87 |
1.06 |
1.06234 |
0.15 |
0.14552602739726 |
$6,871,623 |
6871623.0208784 |
|
 Troy Tulowitzki
 |
Tulowitzki Troy |
SS |
$5,500,000 |
5500000 |
6.68% |
6.68 |
4.68 |
4.67989 |
0.85 |
0.85088909090909 |
$1,175,241 |
1175241.2984066 |
|
 Rafael Betancourt
 |
Betancourt Rafael |
RP |
$3,775,000 |
3775000 |
4.59% |
4.59 |
1.47 |
1.47186 |
0.39 |
0.38989668874172 |
$2,564,782 |
2564781.9765467 |
|
 Jose Lopez
 |
Lopez Jose |
3B |
$3,600,000 |
3600000 |
4.37% |
4.37 |
-0.90 |
-0.898083 |
— |
0 |
— |
0 |
|
 Manny Corpas
 |
Corpas Manny |
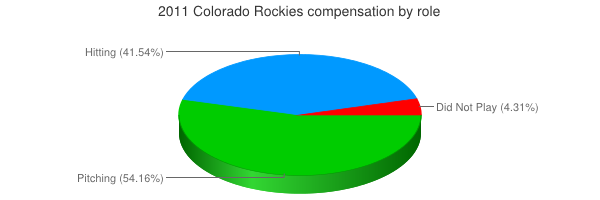
DNP |
$3,550,000 |
3550000 |
4.31% |
4.31 |
— |
0.00 |
— |
0 |
— |
0 |
|
 Ty Wigginton
 |
Wigginton Ty |
3B |
$3,500,000 |
3500000 |
4.25% |
4.25 |
-0.63 |
-0.633324 |
— |
0 |
— |
0 |
|
 Jason Hammel
 |
Hammel Jason |
RP |
$3,000,000 |
3000000 |
3.64% |
3.64 |
-0.49 |
-0.486542 |
— |
0 |
— |
0 |
|
 Matt Lindstrom
 |
Lindstrom Matt |
RP |
$2,800,000 |
2800000 |
3.40% |
3.40 |
0.38 |
0.378352 |
0.14 |
0.13512571428571 |
$7,400,516 |
7400515.9216814 |
|
 Ubaldo Jiménez
 |
Jimenez Ubaldo |
RP |
$2,800,000 |
2800000 |
3.40% |
3.40 |
1.48 |
1.48112 |
0.53 |
0.52897142857143 |
$1,890,461 |
1890461.2725505 |
|
 Chris Iannetta
 |
Iannetta Chris |
C |
$2,630,000 |
2630000 |
3.20% |
3.20 |
0.59 |
0.591742 |
0.22 |
0.2249969581749 |
$4,444,505 |
4444504.5306907 |
|
 Matt Belisle
 |
Belisle Matt |
RP |
$2,350,000 |
2350000 |
2.86% |
2.86 |
0.90 |
0.896215 |
0.38 |
0.38136808510638 |
$2,622,139 |
2622138.660924 |
|
 Ian Stewart
 |
Stewart Ian |
3B |
$2,287,500 |
2287500 |
2.78% |
2.78 |
-0.88 |
-0.883269 |
— |
0 |
— |
0 |
|
 Ryan Spilborghs
 |
Spilborghs Ryan |
PH |
$1,950,000 |
1950000 |
2.37% |
2.37 |
-1.46 |
-1.46106 |
— |
0 |
— |
0 |
|
 Carlos González
 |
Gonzalez Carlos |
LF |
$1,428,571 |
1428571 |
1.74% |
1.74 |
3.46 |
3.45941 |
2.42 |
2.4215877264763 |
$412,952 |
412952.20861361 |
|
 Jason Giambi
 |
Giambi Jason |
PH |
$1,000,000 |
1000000 |
1.21% |
1.21 |
1.21 |
1.21195 |
1.21 |
1.21195 |
$825,117 |
825116.54771236 |
|
 Felipe Paulino
 |
Paulino Felipe |
RP |
$790,000 |
790000 |
0.96% |
0.96 |
0.25 |
0.249056 |
0.32 |
0.31526075949367 |
$3,171,977 |
3171977.3866118 |
|
 Seth Smith
 |
Smith Seth |
RF |
$429,000 |
429000 |
0.52% |
0.52 |
1.67 |
1.67462 |
3.90 |
3.9035431235431 |
$256,178 |
256177.52087041 |
|
 Dexter Fowler
 |
Fowler Dexter |
CF |
$424,000 |
424000 |
0.52% |
0.52 |
5.06 |
5.05957 |
11.93 |
11.932948113208 |
$83,802 |
83801.587881974 |
|
 Franklin Morales
 |
Morales Franklin |
RP |
$424,000 |
424000 |
0.52% |
0.52 |
0.01 |
0.00636967 |
0.02 |
0.015022806603774 |
$66,565,458 |
66565457.865164 |
|
 Jose Morales
 |
Morales Jose |
C |
$420,000 |
420000 |
0.51% |
0.51 |
0.08 |
0.0829608 |
0.20 |
0.19752571428571 |
$5,062,632 |
5062631.9900483 |
|
 Jhoulys Chacín
 |
Chacin Jhoulys |
RP |
$419,000 |
419000 |
0.51% |
0.51 |
2.34 |
2.33691 |
5.58 |
5.5773508353222 |
$179,297 |
179296.59250891 |
|
 Jonathan Herrera
 |
Herrera Jonathan |
2B |
$419,000 |
419000 |
0.51% |
0.51 |
-0.25 |
-0.253376 |
— |
0 |
— |
0 |
|
 Esmil Rogers
 |
Rogers Esmil |
RP |
$417,000 |
417000 |
0.51% |
0.51 |
-1.29 |
-1.28568 |
— |
0 |
— |
0 |
|
 Matt Reynolds
 |
Reynolds Matt |
RP |
$415,000 |
415000 |
0.50% |
0.50 |
0.84 |
0.838145 |
2.02 |
2.0196265060241 |
$495,141 |
495141.05554528 |
|
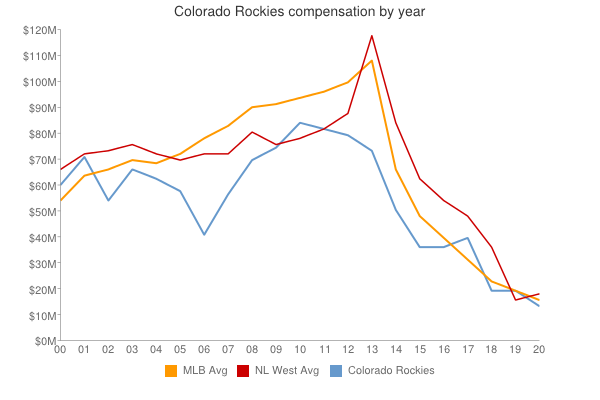
| Year | Rockies payroll |
PR Sort |
Avg payroll |
AvgPR Sort |
Diff |
Diff Sort |
|---|
| 2000 | $61,258,690 | 61258690 | $56,164,089 | 56164089 | $5,094,601 | 5094601 |
| 2001 | $71,198,334 | 71198334 | $65,991,638 | 65991638 | $5,206,696 | 5206696 |
| 2002 | $54,206,543 | 54206543 | $68,244,471 | 68244471 | $-14,037,928 | -14037928 |
| 2003 | $65,830,000 | 65830000 | $71,318,479 | 71318479 | $-5,488,479 | -5488479 |
| 2004 | $63,788,500 | 63788500 | $70,466,961 | 70466961 | $-6,678,461 | -6678461 |
| 2005 | $57,115,500 | 57115500 | $73,264,780 | 73264780 | $-16,149,280 | -16149280 |
| 2006 | $41,666,000 | 41666000 | $79,051,754 | 79051754 | $-37,385,754 | -37385754 |
| 2007 | $57,062,000 | 57062000 | $83,931,138 | 83931138 | $-26,869,138 | -26869138 |
| 2008 | $69,856,500 | 69856500 | $90,812,373 | 90812373 | $-20,955,873 | -20955873 |
| 2009 | $75,605,533 | 75605533 | $91,093,211 | 91093211 | $-15,487,678 | -15487678 |
| 2010 | $84,618,333 | 84618333 | $93,373,681 | 93373681 | $-8,755,348 | -8755348 |
| 2011 | $82,311,404 | 82311404 | $96,102,034 | 96102034 | $-13,790,630 | -13790630 |
| 2012 | $80,164,571 | 80164571 | $100,657,138 | 100657138 | $-20,492,567 | -20492567 |
| 2013 | $74,624,071 | 74624071 | $109,024,990 | 109024990 | $-34,400,919 | -34400919 |
| 2014 | $93,581,071 | 93581071 | $117,828,782 | 117828782 | $-24,247,711 | -24247711 |
| 2015 | $97,069,630 | 97069630 | $127,404,244 | 127404244 | $-30,334,614 | -30334614 |
| 2016 | $112,645,071 | 112645071 | $132,219,407 | 132219407 | $-19,574,336 | -19574336 |
| 2017 | $127,828,571 | 127828571 | $137,302,894 | 137302894 | $-9,474,323 | -9474323 |
| 2018 | $136,953,500 | 136953500 | $136,929,168 | 136929168 | $24,332 | 24332 |
| 2019 | $145,248,500 | 145248500 | $136,944,257 | 136944257 | $8,304,243 | 8304243 |
| 2020 | $154,949,500 | 154949500 | $140,677,788 | 140677788 | $14,271,712 | 14271712 |
| 2021 | $119,764,000 | 119764000 | $132,162,631 | 132162631 | $-12,398,631 | -12398631 |
| 2022 | $150,070,000 | 150070000 | $149,374,046 | 149374046 | $695,954 | 695954 |
| 2023 | $149,598,000 | 149598000 | $160,460,390 | 160460390 | $-10,862,390 | -10862390 |
| 2024 | $125,739,286 | 125739286 | $135,504,022 | 135504022 | $-9,764,736 | -9764736 |
| 2025 | $89,714,286 | 89714286 | $96,417,302 | 96417302 | $-6,703,016 | -6703016 |
| 2026 | $81,964,286 | 81964286 | $76,694,120 | 76694120 | $5,270,166 | 5270166 |
| 2027 | $51,214,286 | 51214286 | $58,935,617 | 58935617 | $-7,721,331 | -7721331 |
| 2028 | $38,214,286 | 38214286 | $45,437,759 | 45437759 | $-7,223,473 | -7223473 |
| 2029 | $14,214,286 | 14214286 | $37,269,628 | 37269628 | $-23,055,342 | -23055342 |
| 2030 | $16,214,286 | 16214286 | $39,665,769 | 39665769 | $-23,451,483 | -23451483 |
| 2031 | $2,500,000 | 2500000 | $38,360,152 | 38360152 | $-35,860,152 | -35860152 |
|
 2011 Colorado Rockies