| Player | Player Sort | Pos | Salary | Salary Sort | Pct | Pct Sort | WARP | WARP Sort | WARP/$M | WARP/$M Sort | $/WARP | $/WARP Sort | Current Status |
|---|
 Todd Helton
 |
Helton Todd |
1B |
$16,600,000 |
16600000 |
23.76% |
23.76 |
0.41 |
0.407856 |
0.02 |
0.024569638554217 |
$40,700,639 |
40700639.441371 |
|
 Matt Holliday
 |
Holliday Matt |
LF |
$9,500,000 |
9500000 |
13.60% |
13.60 |
6.02 |
6.02439 |
0.63 |
0.63414631578947 |
$1,576,923 |
1576923.1407661 |
|
 Brian Fuentes
 |
Fuentes Brian |
RP |
$5,050,000 |
5050000 |
7.23% |
7.23 |
1.25 |
1.24958 |
0.25 |
0.24744158415842 |
$4,041,358 |
4041357.8962531 |
|
 Aaron Cook
 |
Cook Aaron |
RP |
$4,500,000 |
4500000 |
6.44% |
6.44 |
2.17 |
2.16873 |
0.48 |
0.48194 |
$2,074,947 |
2074947.0888492 |
|
 Garrett Atkins
 |
Atkins Garrett |
3B |
$4,387,500 |
4387500 |
6.28% |
6.28 |
0.73 |
0.734836 |
0.17 |
0.16748398860399 |
$5,970,720 |
5970719.9973872 |
|
 Brad Hawpe
 |
Hawpe Brad |
RF |
$3,925,000 |
3925000 |
5.62% |
5.62 |
0.30 |
0.302677 |
0.08 |
0.077115159235669 |
$12,967,619 |
12967618.94693 |
|
 Luis Vizcaino
 |
Vizcaino Luis |
RP |
$3,500,000 |
3500000 |
5.01% |
5.01 |
0.95 |
0.948677 |
0.27 |
0.27105057142857 |
$3,689,348 |
3689348.4294444 |
|
 Kip Wells
 |
Wells Kip |
RP |
$3,100,000 |
3100000 |
4.44% |
4.44 |
-0.23 |
-0.225626 |
— |
0 |
— |
0 |
|
 Yorvit Torrealba
 |
Torrealba Yorvit |
C |
$2,750,000 |
2750000 |
3.94% |
3.94 |
1.02 |
1.0168 |
0.37 |
0.36974545454545 |
$2,704,563 |
2704563.3359559 |
|
 Jeff Francis
 |
Francis Jeff |
RP |
$2,750,000 |
2750000 |
3.94% |
3.94 |
-0.01 |
-0.00875099 |
— |
0 |
— |
0 |
|
 Matt Herges
 |
Herges Matt |
RP |
$2,500,000 |
2500000 |
3.58% |
3.58 |
0.01 |
0.0099225 |
0.00 |
0.003969 |
$251,952,633 |
251952632.90501 |
|
 Willy Taveras
 |
Taveras Willy |
CF |
$1,975,000 |
1975000 |
2.83% |
2.83 |
1.05 |
1.05196 |
0.53 |
0.53263797468354 |
$1,877,448 |
1877447.8117039 |
|
 Jorge De La Rosa
 |
De La Rosa Jorge |
RP |
$1,025,000 |
1025000 |
1.47% |
1.47 |
1.57 |
1.57167 |
1.53 |
1.5333365853659 |
$652,173 |
652172.52985678 |
|
 Cory Sullivan
 |
Sullivan Cory |
PH |
$1,000,000 |
1000000 |
1.43% |
1.43 |
-0.16 |
-0.164586 |
— |
0 |
— |
0 |
|
 Mark Redman
 |
Redman Mark |
RP |
$1,000,000 |
1000000 |
1.43% |
1.43 |
-0.53 |
-0.526704 |
— |
0 |
— |
0 |
|
 Troy Tulowitzki
 |
Tulowitzki Troy |
SS |
$750,000 |
750000 |
1.07% |
1.07 |
1.21 |
1.21411 |
1.62 |
1.6188133333333 |
$617,736 |
617736.44892143 |
|
 Scott Podsednik
 |
Podsednik Scott |
PH |
$750,000 |
750000 |
1.07% |
1.07 |
0.05 |
0.0480312 |
0.06 |
0.0640416 |
$15,614,850 |
15614850.347274 |
|
 Micah Bowie
 |
Bowie Micah |
RP |
$650,000 |
650000 |
0.93% |
0.93 |
0.04 |
0.0387429 |
0.06 |
0.059604461538462 |
$16,777,268 |
16777267.576769 |
|
 Manny Corpas
 |
Corpas Manny |
RP |
$575,000 |
575000 |
0.82% |
0.82 |
-0.49 |
-0.493453 |
— |
0 |
— |
0 |
|
 Clint Barmes
 |
Barmes Clint |
2B |
$405,000 |
405000 |
0.58% |
0.58 |
1.92 |
1.9192 |
4.74 |
4.7387654320988 |
$211,025 |
211025.42726136 |
|
 Jeff Baker
 |
Baker Jeff |
2B |
$403,000 |
403000 |
0.58% |
0.58 |
0.73 |
0.727908 |
1.81 |
1.806223325062 |
$553,641 |
553641.39424213 |
|
 Taylor Buchholz
 |
Buchholz Taylor |
RP |
$399,000 |
399000 |
0.57% |
0.57 |
1.43 |
1.43154 |
3.59 |
3.5878195488722 |
$278,721 |
278720.81813991 |
|
 Jason Hirsh
 |
Hirsh Jason |
RP |
$396,000 |
396000 |
0.57% |
0.57 |
-0.13 |
-0.130576 |
— |
0 |
— |
0 |
|
 Ryan Spilborghs
 |
Spilborghs Ryan |
PH |
$396,000 |
396000 |
0.57% |
0.57 |
1.17 |
1.16857 |
2.95 |
2.9509343434343 |
$338,876 |
338875.71989697 |
|
 Chris Iannetta
 |
Iannetta Chris |
C |
$396,000 |
396000 |
0.57% |
0.57 |
1.48 |
1.4772 |
3.73 |
3.730303030303 |
$268,075 |
268074.735987 |
|
 Ubaldo Jiménez
 |
Jimenez Ubaldo |
RP |
$392,000 |
392000 |
0.56% |
0.56 |
2.61 |
2.61327 |
6.67 |
6.6665051020408 |
$150,004 |
150003.63529218 |
|
 Franklin Morales
 |
Morales Franklin |
RP |
$391,000 |
391000 |
0.56% |
0.56 |
-0.82 |
-0.818818 |
— |
0 |
— |
0 |
|
 Josh Newman
 |
Newman Josh |
RP |
$391,000 |
391000 |
0.56% |
0.56 |
-0.41 |
-0.410665 |
— |
0 |
— |
0 |
|
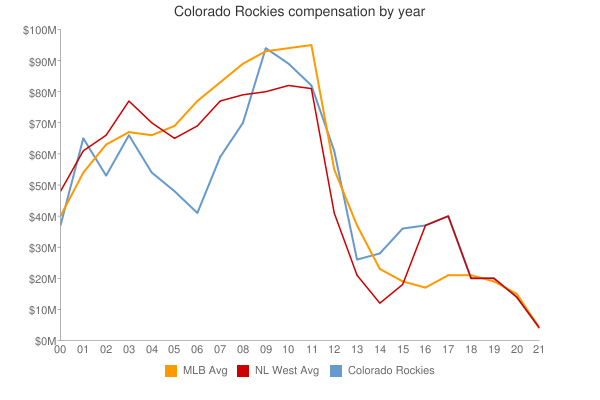
| Year | Rockies payroll |
PR Sort |
Avg payroll |
AvgPR Sort |
Diff |
Diff Sort |
|---|
| 2000 | $61,258,690 | 61258690 | $56,164,089 | 56164089 | $5,094,601 | 5094601 |
| 2001 | $71,198,334 | 71198334 | $65,991,638 | 65991638 | $5,206,696 | 5206696 |
| 2002 | $54,206,543 | 54206543 | $68,244,471 | 68244471 | $-14,037,928 | -14037928 |
| 2003 | $65,830,000 | 65830000 | $71,318,479 | 71318479 | $-5,488,479 | -5488479 |
| 2004 | $63,788,500 | 63788500 | $70,466,961 | 70466961 | $-6,678,461 | -6678461 |
| 2005 | $57,115,500 | 57115500 | $73,264,780 | 73264780 | $-16,149,280 | -16149280 |
| 2006 | $41,666,000 | 41666000 | $79,051,754 | 79051754 | $-37,385,754 | -37385754 |
| 2007 | $57,062,000 | 57062000 | $83,931,138 | 83931138 | $-26,869,138 | -26869138 |
| 2008 | $69,856,500 | 69856500 | $90,812,373 | 90812373 | $-20,955,873 | -20955873 |
| 2009 | $75,605,533 | 75605533 | $91,093,211 | 91093211 | $-15,487,678 | -15487678 |
| 2010 | $84,618,333 | 84618333 | $93,373,681 | 93373681 | $-8,755,348 | -8755348 |
| 2011 | $82,311,404 | 82311404 | $96,102,034 | 96102034 | $-13,790,630 | -13790630 |
| 2012 | $80,164,571 | 80164571 | $100,657,138 | 100657138 | $-20,492,567 | -20492567 |
| 2013 | $74,624,071 | 74624071 | $109,024,990 | 109024990 | $-34,400,919 | -34400919 |
| 2014 | $93,581,071 | 93581071 | $117,828,782 | 117828782 | $-24,247,711 | -24247711 |
| 2015 | $97,069,630 | 97069630 | $127,404,244 | 127404244 | $-30,334,614 | -30334614 |
| 2016 | $112,645,071 | 112645071 | $132,219,407 | 132219407 | $-19,574,336 | -19574336 |
| 2017 | $127,828,571 | 127828571 | $137,302,894 | 137302894 | $-9,474,323 | -9474323 |
| 2018 | $136,953,500 | 136953500 | $136,929,168 | 136929168 | $24,332 | 24332 |
| 2019 | $145,248,500 | 145248500 | $136,944,257 | 136944257 | $8,304,243 | 8304243 |
| 2020 | $154,949,500 | 154949500 | $140,677,788 | 140677788 | $14,271,712 | 14271712 |
| 2021 | $119,764,000 | 119764000 | $132,162,631 | 132162631 | $-12,398,631 | -12398631 |
| 2022 | $150,070,000 | 150070000 | $149,374,046 | 149374046 | $695,954 | 695954 |
| 2023 | $149,598,000 | 149598000 | $160,460,390 | 160460390 | $-10,862,390 | -10862390 |
| 2024 | $125,739,286 | 125739286 | $135,504,022 | 135504022 | $-9,764,736 | -9764736 |
| 2025 | $89,714,286 | 89714286 | $96,417,302 | 96417302 | $-6,703,016 | -6703016 |
| 2026 | $81,964,286 | 81964286 | $76,694,120 | 76694120 | $5,270,166 | 5270166 |
| 2027 | $51,214,286 | 51214286 | $58,935,617 | 58935617 | $-7,721,331 | -7721331 |
| 2028 | $38,214,286 | 38214286 | $45,437,759 | 45437759 | $-7,223,473 | -7223473 |
| 2029 | $14,214,286 | 14214286 | $37,269,628 | 37269628 | $-23,055,342 | -23055342 |
| 2030 | $16,214,286 | 16214286 | $39,665,769 | 39665769 | $-23,451,483 | -23451483 |
| 2031 | $2,500,000 | 2500000 | $38,360,152 | 38360152 | $-35,860,152 | -35860152 |
|
 2008 Colorado Rockies