| Player | Player Sort | Pos | Salary | Salary Sort | Pct | Pct Sort | WARP | WARP Sort | WARP/$M | WARP/$M Sort | $/WARP | $/WARP Sort | Current Status |
|---|
 Aaron Harang
 |
Harang Aaron |
RP |
$12,500,000 |
12500000 |
16.26% |
16.26 |
0.77 |
0.771522 |
0.06 |
0.06172176 |
$16,201,741 |
16201741.49279 |
|
 Bronson Arroyo
 |
Arroyo Bronson |
RP |
$12,250,000 |
12250000 |
15.93% |
15.93 |
3.84 |
3.8416 |
0.31 |
0.3136 |
$3,188,776 |
3188775.5102041 |
|
 Francisco Cordero
 |
Cordero Francisco |
RP |
$12,125,000 |
12125000 |
15.77% |
15.77 |
0.49 |
0.488205 |
0.04 |
0.040264329896907 |
$24,835,878 |
24835878.370766 |
|
 Scott Rolen
 |
Rolen Scott |
3B |
$7,666,667 |
7666667 |
9.97% |
9.97 |
4.56 |
4.56441 |
0.60 |
0.59535780020183 |
$1,679,662 |
1679662.2126408 |
|
 Brandon Phillips
 |
Phillips Brandon |
2B |
$6,937,500 |
6937500 |
9.02% |
9.02 |
4.08 |
4.08151 |
0.59 |
0.58832576576577 |
$1,699,739 |
1699738.5771442 |
|
 Aroldis Chapman
 |
Chapman Aroldis |
RP |
$3,708,333 |
3708333 |
4.82% |
4.82 |
0.42 |
0.417193 |
0.11 |
0.11250149325856 |
$8,888,771 |
8888770.9045933 |
|
 Ramon Hernandez
 |
Hernandez Ramon |
C |
$3,000,000 |
3000000 |
3.90% |
3.90 |
3.00 |
3.0021 |
1.00 |
1.0007 |
$999,300 |
999300.48965724 |
|
 Aaron Miles
 |
Miles Aaron |
DNP |
$2,700,000 |
2700000 |
3.51% |
3.51 |
— |
0.00 |
— |
0 |
— |
0 |
|
 Mike Lincoln
 |
Lincoln Mike |
RP |
$2,500,000 |
2500000 |
3.25% |
3.25 |
-0.05 |
-0.0466611 |
— |
0 |
— |
0 |
|
 Orlando Cabrera
 |
Cabrera Orlando |
SS |
$2,020,000 |
2020000 |
2.63% |
2.63 |
0.62 |
0.619341 |
0.31 |
0.30660445544554 |
$3,261,531 |
3261531.2081713 |
|
 Arthur Rhodes
 |
Rhodes Arthur |
RP |
$2,000,000 |
2000000 |
2.60% |
2.60 |
1.10 |
1.10493 |
0.55 |
0.552465 |
$1,810,069 |
1810069.4161621 |
|
 Nick Masset
 |
Masset Nick |
RP |
$1,035,000 |
1035000 |
1.35% |
1.35 |
1.62 |
1.61728 |
1.56 |
1.5625893719807 |
$639,963 |
639963.39533043 |
|
 Yonder Alonso
 |
Alonso Yonder |
PH |
$900,000 |
900000 |
1.17% |
1.17 |
-0.10 |
-0.102842 |
— |
0 |
— |
0 |
|
 Jonny Gomes
 |
Gomes Jonny |
LF |
$800,000 |
800000 |
1.04% |
1.04 |
1.85 |
1.84957 |
2.31 |
2.3119625 |
$432,533 |
432532.96712209 |
|
 Yasmani Grandal
 |
Grandal Yasmani |
DNP |
$750,000 |
750000 |
0.98% |
0.98 |
— |
0.00 |
— |
0 |
— |
0 |
|
 Joey Votto
 |
Votto Joey |
1B |
$525,000 |
525000 |
0.68% |
0.68 |
7.78 |
7.78488 |
14.83 |
14.828342857143 |
$67,438 |
67438.419089312 |
|
 Edinson Vólquez
 |
Volquez Edinson |
RP |
$445,000 |
445000 |
0.58% |
0.58 |
1.68 |
1.6767 |
3.77 |
3.7678651685393 |
$265,402 |
265402.27828473 |
|
 Johnny Cueto
 |
Cueto Johnny |
RP |
$445,000 |
445000 |
0.58% |
0.58 |
2.36 |
2.35677 |
5.30 |
5.2961123595506 |
$188,818 |
188817.7463223 |
|
 Micah Owings
 |
Owings Micah |
RP |
$440,000 |
440000 |
0.57% |
0.57 |
-0.01 |
-0.00702801 |
— |
0 |
— |
0 |
|
 Jay Bruce
 |
Bruce Jay |
RF |
$440,000 |
440000 |
0.57% |
0.57 |
5.80 |
5.80232 |
13.19 |
13.187090909091 |
$75,832 |
75831.736271009 |
|
 Homer Bailey
 |
Bailey Homer |
RP |
$418,000 |
418000 |
0.54% |
0.54 |
1.72 |
1.71887 |
4.11 |
4.1121291866029 |
$243,183 |
243183.0214036 |
|
 Wladimir Balentien
 |
Balentien Wladimir |
DNP |
$416,000 |
416000 |
0.54% |
0.54 |
— |
0.00 |
— |
0 |
— |
0 |
|
 Ryan Hanigan
 |
Hanigan Ryan |
C |
$415,000 |
415000 |
0.54% |
0.54 |
3.42 |
3.42202 |
8.25 |
8.2458313253012 |
$121,273 |
121273.39992168 |
|
 Chris Dickerson
 |
Dickerson Chris |
LF |
$415,000 |
415000 |
0.54% |
0.54 |
-0.14 |
-0.144415 |
— |
0 |
— |
0 |
|
 Paul Janish
 |
Janish Paul |
SS |
$412,500 |
412500 |
0.54% |
0.54 |
0.67 |
0.671386 |
1.63 |
1.6276024242424 |
$614,401 |
614400.65774383 |
|
 Daniel Herrera
 |
Herrera Daniel |
RP |
$412,500 |
412500 |
0.54% |
0.54 |
-0.02 |
-0.0193052 |
— |
0 |
— |
0 |
|
 Logan Ondrusek
 |
Ondrusek Logan |
RP |
$400,000 |
400000 |
0.52% |
0.52 |
0.60 |
0.596811 |
1.49 |
1.4920275 |
$670,229 |
670228.93344794 |
|
 Drew Stubbs
 |
Stubbs Drew |
CF |
$400,000 |
400000 |
0.52% |
0.52 |
4.61 |
4.60782 |
11.52 |
11.51955 |
$86,809 |
86808.946530029 |
|
 Juan Francisco
 |
Francisco Juan |
PH |
$400,000 |
400000 |
0.52% |
0.52 |
-0.05 |
-0.0475008 |
— |
0 |
— |
0 |
|
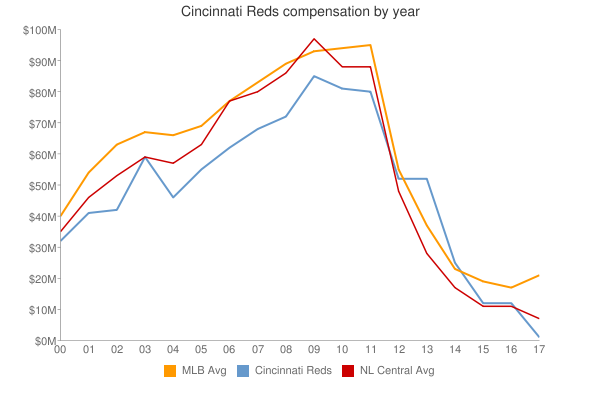
| Year | Reds payroll |
PR Sort |
Avg payroll |
AvgPR Sort |
Diff |
Diff Sort |
|---|
| 2000 | $44,767,200 | 44767200 | $56,164,089 | 56164089 | $-11,396,889 | -11396889 |
| 2001 | $47,974,000 | 47974000 | $65,991,638 | 65991638 | $-18,017,638 | -18017638 |
| 2002 | $43,203,890 | 43203890 | $68,244,471 | 68244471 | $-25,040,581 | -25040581 |
| 2003 | $58,541,000 | 58541000 | $71,318,479 | 71318479 | $-12,777,479 | -12777479 |
| 2004 | $46,697,250 | 46697250 | $70,466,961 | 70466961 | $-23,769,711 | -23769711 |
| 2005 | $62,594,583 | 62594583 | $73,264,780 | 73264780 | $-10,670,197 | -10670197 |
| 2006 | $63,631,833 | 63631833 | $79,051,754 | 79051754 | $-15,419,921 | -15419921 |
| 2007 | $69,910,833 | 69910833 | $83,931,138 | 83931138 | $-14,020,305 | -14020305 |
| 2008 | $72,240,000 | 72240000 | $90,812,373 | 90812373 | $-18,572,373 | -18572373 |
| 2009 | $72,283,500 | 72283500 | $91,093,211 | 91093211 | $-18,809,711 | -18809711 |
| 2010 | $76,876,500 | 76876500 | $93,373,681 | 93373681 | $-16,497,181 | -16497181 |
| 2011 | $76,631,134 | 76631134 | $96,102,034 | 96102034 | $-19,470,900 | -19470900 |
| 2012 | $87,826,167 | 87826167 | $100,657,138 | 100657138 | $-12,830,971 | -12830971 |
| 2013 | $111,105,533 | 111105533 | $109,024,990 | 109024990 | $2,080,543 | 2080543 |
| 2014 | $115,384,724 | 115384724 | $117,828,782 | 117828782 | $-2,444,058 | -2444058 |
| 2015 | $115,373,953 | 115373953 | $127,404,244 | 127404244 | $-12,030,291 | -12030291 |
| 2016 | $90,416,228 | 90416228 | $132,219,407 | 132219407 | $-41,803,179 | -41803179 |
| 2017 | $95,375,786 | 95375786 | $137,302,894 | 137302894 | $-41,927,108 | -41927108 |
| 2018 | $101,337,500 | 101337500 | $136,929,168 | 136929168 | $-35,591,668 | -35591668 |
| 2019 | $127,218,214 | 127218214 | $136,944,257 | 136944257 | $-9,726,043 | -9726043 |
| 2020 | $145,670,792 | 145670792 | $140,677,788 | 140677788 | $4,993,004 | 4993004 |
| 2021 | $129,642,381 | 129642381 | $132,162,631 | 132162631 | $-2,520,250 | -2520250 |
| 2022 | $107,955,000 | 107955000 | $149,374,046 | 149374046 | $-41,419,046 | -41419046 |
| 2023 | $94,198,333 | 94198333 | $160,460,390 | 160460390 | $-66,262,057 | -66262057 |
| 2024 | $100,758,333 | 100758333 | $135,504,022 | 135504022 | $-34,745,689 | -34745689 |
| 2025 | $74,483,333 | 74483333 | $96,417,302 | 96417302 | $-21,933,969 | -21933969 |
| 2026 | $45,483,333 | 45483333 | $76,694,120 | 76694120 | $-31,210,787 | -31210787 |
| 2027 | $42,483,333 | 42483333 | $58,935,617 | 58935617 | $-16,452,284 | -16452284 |
| 2028 | $16,333,333 | 16333333 | $45,437,759 | 45437759 | $-29,104,426 | -29104426 |
| 2029 | $2,000,000 | 2000000 | $37,269,628 | 37269628 | $-35,269,628 | -35269628 |
|
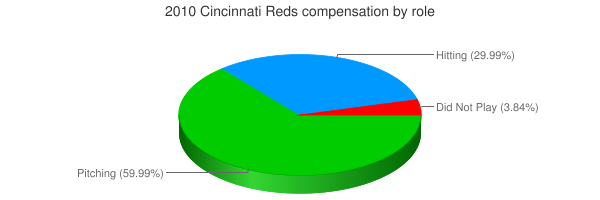
 2010 Cincinnati Reds