| Player | Player Sort | Pos | Salary | Salary Sort | Pct | Pct Sort | WARP | WARP Sort | WARP/$M | WARP/$M Sort | $/WARP | $/WARP Sort | Current Status |
|---|
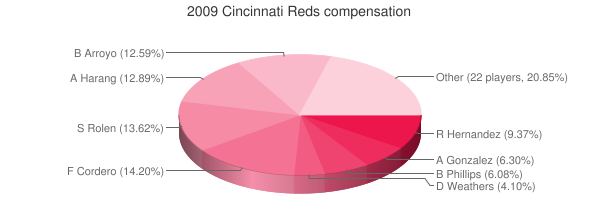
 Francisco Cordero
 |
Cordero Francisco |
RP |
$12,125,000 |
12125000 |
16.77% |
16.77 |
1.05 |
1.05078 |
0.09 |
0.086662268041237 |
$11,539,047 |
11539047.183997 |
|
 Aaron Harang
 |
Harang Aaron |
RP |
$11,000,000 |
11000000 |
15.22% |
15.22 |
2.96 |
2.95842 |
0.27 |
0.26894727272727 |
$3,718,201 |
3718200.9315783 |
|
 Bronson Arroyo
 |
Arroyo Bronson |
RP |
$10,750,000 |
10750000 |
14.87% |
14.87 |
3.75 |
3.75055 |
0.35 |
0.34888837209302 |
$2,866,246 |
2866246.2838784 |
|
 Ramon Hernandez
 |
Hernandez Ramon |
C |
$8,000,000 |
8000000 |
11.07% |
11.07 |
0.78 |
0.775133 |
0.10 |
0.096891625 |
$10,320,809 |
10320809.461086 |
|
 Alex Gonzalez
 |
Gonzalez Alex |
SS |
$5,375,000 |
5375000 |
7.44% |
7.44 |
-0.96 |
-0.959706 |
— |
0 |
— |
0 |
|
 Brandon Phillips
 |
Phillips Brandon |
2B |
$5,187,500 |
5187500 |
7.18% |
7.18 |
2.27 |
2.26771 |
0.44 |
0.43714891566265 |
$2,287,550 |
2287549.9953698 |
|
 David Weathers
 |
Weathers David |
RP |
$3,500,000 |
3500000 |
4.84% |
4.84 |
0.46 |
0.462601 |
0.13 |
0.13217171428571 |
$7,565,915 |
7565915.3352457 |
|
 Edwin Encarnación
 |
Encarnacion Edwin |
3B |
$2,425,000 |
2425000 |
3.35% |
3.35 |
-0.20 |
-0.203999 |
— |
0 |
— |
0 |
|
 Willy Taveras
 |
Taveras Willy |
CF |
$2,250,000 |
2250000 |
3.11% |
3.11 |
0.10 |
0.101917 |
0.05 |
0.045296444444444 |
$22,076,788 |
22076787.974528 |
|
 Arthur Rhodes
 |
Rhodes Arthur |
RP |
$2,000,000 |
2000000 |
2.77% |
2.77 |
0.54 |
0.540101 |
0.27 |
0.2700505 |
$3,703,011 |
3703011.1034788 |
|
 Jerry Hairston
 |
Hairston Jerry |
3B |
$2,000,000 |
2000000 |
2.77% |
2.77 |
0.72 |
0.717978 |
0.36 |
0.358989 |
$2,785,601 |
2785600.6730011 |
|
 Mike Lincoln
 |
Lincoln Mike |
RP |
$1,500,000 |
1500000 |
2.08% |
2.08 |
-0.54 |
-0.544622 |
— |
0 |
— |
0 |
|
 Yonder Alonso
 |
Alonso Yonder |
DNP |
$800,000 |
800000 |
1.11% |
1.11 |
— |
0.00 |
— |
0 |
— |
0 |
|
 Edinson Vólquez
 |
Volquez Edinson |
RP |
$440,000 |
440000 |
0.61% |
0.61 |
0.52 |
0.524458 |
1.19 |
1.19195 |
$838,961 |
838961.3658291 |
|
 Joey Votto
 |
Votto Joey |
1B |
$437,500 |
437500 |
0.61% |
0.61 |
4.92 |
4.92485 |
11.26 |
11.2568 |
$88,835 |
88835.192950039 |
|
 Jared Burton
 |
Burton Jared |
RP |
$420,000 |
420000 |
0.58% |
0.58 |
0.69 |
0.687079 |
1.64 |
1.6359023809524 |
$611,283 |
611283.41864618 |
|
 Micah Owings
 |
Owings Micah |
RP |
$420,000 |
420000 |
0.58% |
0.58 |
-0.82 |
-0.817649 |
— |
0 |
— |
0 |
|
 Johnny Cueto
 |
Cueto Johnny |
RP |
$418,000 |
418000 |
0.58% |
0.58 |
0.58 |
0.582319 |
1.39 |
1.3931076555024 |
$717,820 |
717819.6143351 |
|
 Nick Masset
 |
Masset Nick |
RP |
$418,000 |
418000 |
0.58% |
0.58 |
2.15 |
2.15214 |
5.15 |
5.1486602870813 |
$194,225 |
194225.28274183 |
|
 Jay Bruce
 |
Bruce Jay |
RF |
$417,500 |
417500 |
0.58% |
0.58 |
2.18 |
2.18389 |
5.23 |
5.230874251497 |
$191,173 |
191172.63232122 |
|
 Paul Janish
 |
Janish Paul |
SS |
$400,000 |
400000 |
0.55% |
0.55 |
0.95 |
0.945964 |
2.36 |
2.36491 |
$422,849 |
422849.07248056 |
|
 Ryan Hanigan
 |
Hanigan Ryan |
C |
$400,000 |
400000 |
0.55% |
0.55 |
3.49 |
3.49446 |
8.74 |
8.73615 |
$114,467 |
114466.89903447 |
|
 Chris Dickerson
 |
Dickerson Chris |
LF |
$400,000 |
400000 |
0.55% |
0.55 |
1.54 |
1.54456 |
3.86 |
3.8614 |
$258,973 |
258973.42932615 |
|
 Terrell Young
 |
Young Terrell |
DNP |
$400,000 |
400000 |
0.55% |
0.55 |
— |
0.00 |
— |
0 |
— |
0 |
|
 Darnell McDonald
 |
McDonald Darnell |
LF |
$400,000 |
400000 |
0.55% |
0.55 |
-0.20 |
-0.197596 |
— |
0 |
— |
0 |
|
 Daniel Herrera
 |
Herrera Daniel |
RP |
$400,000 |
400000 |
0.55% |
0.55 |
1.07 |
1.06981 |
2.67 |
2.674525 |
$373,898 |
373898.16883372 |
|
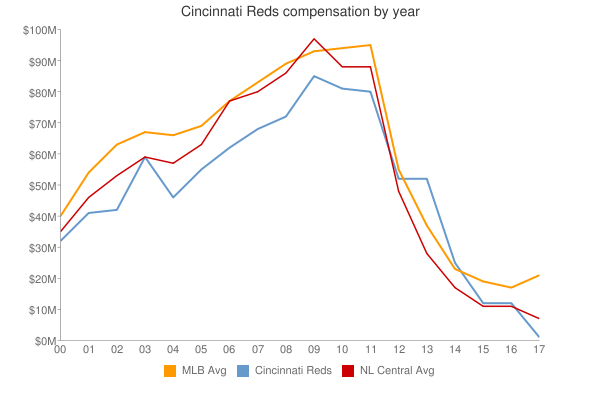
| Year | Reds payroll |
PR Sort |
Avg payroll |
AvgPR Sort |
Diff |
Diff Sort |
|---|
| 2000 | $44,767,200 | 44767200 | $56,164,089 | 56164089 | $-11,396,889 | -11396889 |
| 2001 | $47,974,000 | 47974000 | $65,991,638 | 65991638 | $-18,017,638 | -18017638 |
| 2002 | $43,203,890 | 43203890 | $68,244,471 | 68244471 | $-25,040,581 | -25040581 |
| 2003 | $58,541,000 | 58541000 | $71,318,479 | 71318479 | $-12,777,479 | -12777479 |
| 2004 | $46,697,250 | 46697250 | $70,466,961 | 70466961 | $-23,769,711 | -23769711 |
| 2005 | $62,594,583 | 62594583 | $73,264,780 | 73264780 | $-10,670,197 | -10670197 |
| 2006 | $63,631,833 | 63631833 | $79,051,754 | 79051754 | $-15,419,921 | -15419921 |
| 2007 | $69,910,833 | 69910833 | $83,931,138 | 83931138 | $-14,020,305 | -14020305 |
| 2008 | $72,240,000 | 72240000 | $90,812,373 | 90812373 | $-18,572,373 | -18572373 |
| 2009 | $72,283,500 | 72283500 | $91,093,211 | 91093211 | $-18,809,711 | -18809711 |
| 2010 | $76,876,500 | 76876500 | $93,373,681 | 93373681 | $-16,497,181 | -16497181 |
| 2011 | $76,631,134 | 76631134 | $96,102,034 | 96102034 | $-19,470,900 | -19470900 |
| 2012 | $87,826,167 | 87826167 | $100,657,138 | 100657138 | $-12,830,971 | -12830971 |
| 2013 | $111,105,533 | 111105533 | $109,024,990 | 109024990 | $2,080,543 | 2080543 |
| 2014 | $115,384,724 | 115384724 | $117,828,782 | 117828782 | $-2,444,058 | -2444058 |
| 2015 | $115,373,953 | 115373953 | $127,404,244 | 127404244 | $-12,030,291 | -12030291 |
| 2016 | $90,416,228 | 90416228 | $132,219,407 | 132219407 | $-41,803,179 | -41803179 |
| 2017 | $95,375,786 | 95375786 | $137,302,894 | 137302894 | $-41,927,108 | -41927108 |
| 2018 | $101,337,500 | 101337500 | $136,929,168 | 136929168 | $-35,591,668 | -35591668 |
| 2019 | $127,218,214 | 127218214 | $136,944,257 | 136944257 | $-9,726,043 | -9726043 |
| 2020 | $145,670,792 | 145670792 | $140,677,788 | 140677788 | $4,993,004 | 4993004 |
| 2021 | $129,642,381 | 129642381 | $132,162,631 | 132162631 | $-2,520,250 | -2520250 |
| 2022 | $107,955,000 | 107955000 | $149,374,046 | 149374046 | $-41,419,046 | -41419046 |
| 2023 | $94,198,333 | 94198333 | $160,460,390 | 160460390 | $-66,262,057 | -66262057 |
| 2024 | $100,758,333 | 100758333 | $135,504,022 | 135504022 | $-34,745,689 | -34745689 |
| 2025 | $74,483,333 | 74483333 | $96,417,302 | 96417302 | $-21,933,969 | -21933969 |
| 2026 | $45,483,333 | 45483333 | $76,694,120 | 76694120 | $-31,210,787 | -31210787 |
| 2027 | $42,483,333 | 42483333 | $58,935,617 | 58935617 | $-16,452,284 | -16452284 |
| 2028 | $16,333,333 | 16333333 | $45,437,759 | 45437759 | $-29,104,426 | -29104426 |
| 2029 | $2,000,000 | 2000000 | $37,269,628 | 37269628 | $-35,269,628 | -35269628 |
|
 2009 Cincinnati Reds