| Player | Player Sort | Pos | Salary | Salary Sort | Pct | Pct Sort | WARP | WARP Sort | WARP/$M | WARP/$M Sort | $/WARP | $/WARP Sort | Current Status |
|---|
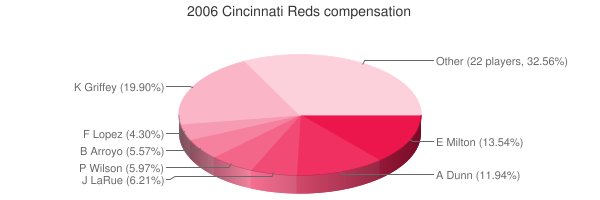
 Ken Griffey Jr.
 |
Griffey Ken |
CF |
$12,500,000 |
12500000 |
19.64% |
19.64 |
0.62 |
0.619407 |
0.05 |
0.04955256 |
$20,180,592 |
20180592.082427 |
|
 Eric Milton
 |
Milton Eric |
RP |
$9,833,333 |
9833333 |
15.45% |
15.45 |
-0.89 |
-0.887172 |
— |
0 |
— |
0 |
|
 Adam Dunn
 |
Dunn Adam |
LF |
$7,500,000 |
7500000 |
11.79% |
11.79 |
2.77 |
2.77188 |
0.37 |
0.369584 |
$2,705,745 |
2705744.8374389 |
|
 Jason LaRue
 |
LaRue Jason |
C |
$3,900,000 |
3900000 |
6.13% |
6.13 |
0.99 |
0.994697 |
0.26 |
0.25505051282051 |
$3,920,792 |
3920791.9597626 |
|
 Paul Wilson
 |
Wilson Paul |
DNP |
$3,750,000 |
3750000 |
5.89% |
5.89 |
— |
0.00 |
— |
0 |
— |
0 |
|
 Bronson Arroyo
 |
Arroyo Bronson |
RP |
$3,000,000 |
3000000 |
4.71% |
4.71 |
5.09 |
5.09089 |
1.70 |
1.6969633333333 |
$589,288 |
589287.92411543 |
|
 Felipe Lopez
 |
Lopez Felipe |
SS |
$2,700,000 |
2700000 |
4.24% |
4.24 |
1.72 |
1.71974 |
0.64 |
0.63694074074074 |
$1,570,005 |
1570004.7681626 |
|
 Aaron Harang
 |
Harang Aaron |
RP |
$2,350,000 |
2350000 |
3.69% |
3.69 |
6.00 |
5.99867 |
2.55 |
2.5526255319149 |
$391,754 |
391753.50536035 |
|
 Tony Womack
 |
Womack Tony |
2B |
$2,000,000 |
2000000 |
3.14% |
3.14 |
-0.00 |
-0.0010505 |
— |
0 |
— |
0 |
|
 Austin Kearns
 |
Kearns Austin |
RF |
$1,850,000 |
1850000 |
2.91% |
2.91 |
2.18 |
2.17939 |
1.18 |
1.1780486486486 |
$848,861 |
848861.37864265 |
|
 David Weathers
 |
Weathers David |
RP |
$1,500,000 |
1500000 |
2.36% |
2.36 |
0.04 |
0.0440835 |
0.03 |
0.029389 |
$34,026,336 |
34026336.384361 |
|
 Dave Williams
 |
Williams Dave |
RP |
$1,400,000 |
1400000 |
2.20% |
2.20 |
-0.16 |
-0.162262 |
— |
0 |
— |
0 |
|
 Kent Mercker
 |
Mercker Kent |
RP |
$1,350,000 |
1350000 |
2.12% |
2.12 |
-0.13 |
-0.131063 |
— |
0 |
— |
0 |
|
 Ryan Freel
 |
Freel Ryan |
CF |
$1,300,000 |
1300000 |
2.04% |
2.04 |
3.47 |
3.46956 |
2.67 |
2.6688923076923 |
$374,687 |
374687.2802315 |
|
 Rich Aurilia
 |
Aurilia Rich |
3B |
$1,300,000 |
1300000 |
2.04% |
2.04 |
3.38 |
3.37672 |
2.60 |
2.5974769230769 |
$384,989 |
384988.98339217 |
|
 Javier Valentin
 |
Valentin Javier |
PH |
$1,150,000 |
1150000 |
1.81% |
1.81 |
0.65 |
0.649996 |
0.57 |
0.56521391304348 |
$1,769,242 |
1769241.6568717 |
|
 Todd Hollandsworth
 |
Hollandsworth Todd |
RF |
$900,000 |
900000 |
1.41% |
1.41 |
-0.07 |
-0.0723045 |
— |
0 |
— |
0 |
|
 Chris Hammond
 |
Hammond Chris |
RP |
$800,000 |
800000 |
1.26% |
1.26 |
0.70 |
0.704651 |
0.88 |
0.88081375 |
$1,135,314 |
1135313.7936369 |
|
 Scott Hatteberg
 |
Hatteberg Scott |
1B |
$750,000 |
750000 |
1.18% |
1.18 |
1.34 |
1.34003 |
1.79 |
1.7867066666667 |
$559,689 |
559688.96218741 |
|
 Rick White
 |
White Rick |
RP |
$600,000 |
600000 |
0.94% |
0.94 |
0.62 |
0.620192 |
1.03 |
1.0336533333333 |
$967,442 |
967442.34043651 |
|
 David Ross
 |
Ross David |
C |
$500,000 |
500000 |
0.79% |
0.79 |
3.96 |
3.95705 |
7.91 |
7.9141 |
$126,357 |
126356.75566394 |
|
 Brandon Claussen
 |
Claussen Brandon |
RP |
$370,000 |
370000 |
0.58% |
0.58 |
0.77 |
0.76902 |
2.08 |
2.0784324324324 |
$481,132 |
481131.83012145 |
|
 Matt Belisle
 |
Belisle Matt |
RP |
$343,500 |
343500 |
0.54% |
0.54 |
0.18 |
0.175445 |
0.51 |
0.51075691411936 |
$1,957,879 |
1957878.5374334 |
|
 Todd Coffey
 |
Coffey Todd |
RP |
$339,000 |
339000 |
0.53% |
0.53 |
1.04 |
1.03942 |
3.07 |
3.0661356932153 |
$326,143 |
326143.4261415 |
|
 Edwin Encarnación
 |
Encarnacion Edwin |
3B |
$332,500 |
332500 |
0.52% |
0.52 |
2.21 |
2.21087 |
6.65 |
6.6492330827068 |
$150,393 |
150393.28409178 |
|
 Mike Burns
 |
Burns Mike |
RP |
$332,500 |
332500 |
0.52% |
0.52 |
0.36 |
0.364758 |
1.10 |
1.0970165413534 |
$911,563 |
911563.28305342 |
|
 Jesus Delgado
 |
Delgado Jesus |
DNP |
$327,000 |
327000 |
0.51% |
0.51 |
— |
0.00 |
— |
0 |
— |
0 |
Arb1/2012, Arb2/2013 |
 Andy Abad
 |
Abad Andy |
PH |
$327,000 |
327000 |
0.51% |
0.51 |
-0.02 |
-0.0188686 |
— |
0 |
— |
0 |
|
 Chris Denorfia
 |
Denorfia Chris |
RF |
$327,000 |
327000 |
0.51% |
0.51 |
0.36 |
0.357194 |
1.09 |
1.0923363914373 |
$915,469 |
915468.90485283 |
|
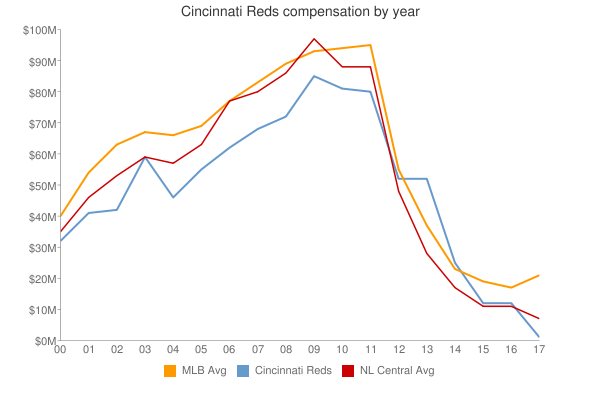
| Year | Reds payroll |
PR Sort |
Avg payroll |
AvgPR Sort |
Diff |
Diff Sort |
|---|
| 2000 | $44,767,200 | 44767200 | $56,164,089 | 56164089 | $-11,396,889 | -11396889 |
| 2001 | $47,974,000 | 47974000 | $65,991,638 | 65991638 | $-18,017,638 | -18017638 |
| 2002 | $43,203,890 | 43203890 | $68,244,471 | 68244471 | $-25,040,581 | -25040581 |
| 2003 | $58,541,000 | 58541000 | $71,318,479 | 71318479 | $-12,777,479 | -12777479 |
| 2004 | $46,697,250 | 46697250 | $70,466,961 | 70466961 | $-23,769,711 | -23769711 |
| 2005 | $62,594,583 | 62594583 | $73,264,780 | 73264780 | $-10,670,197 | -10670197 |
| 2006 | $63,631,833 | 63631833 | $79,051,754 | 79051754 | $-15,419,921 | -15419921 |
| 2007 | $69,910,833 | 69910833 | $83,931,138 | 83931138 | $-14,020,305 | -14020305 |
| 2008 | $72,240,000 | 72240000 | $90,812,373 | 90812373 | $-18,572,373 | -18572373 |
| 2009 | $72,283,500 | 72283500 | $91,093,211 | 91093211 | $-18,809,711 | -18809711 |
| 2010 | $76,876,500 | 76876500 | $93,373,681 | 93373681 | $-16,497,181 | -16497181 |
| 2011 | $76,631,134 | 76631134 | $96,102,034 | 96102034 | $-19,470,900 | -19470900 |
| 2012 | $87,826,167 | 87826167 | $100,657,138 | 100657138 | $-12,830,971 | -12830971 |
| 2013 | $111,105,533 | 111105533 | $109,024,990 | 109024990 | $2,080,543 | 2080543 |
| 2014 | $115,384,724 | 115384724 | $117,828,782 | 117828782 | $-2,444,058 | -2444058 |
| 2015 | $115,373,953 | 115373953 | $127,404,244 | 127404244 | $-12,030,291 | -12030291 |
| 2016 | $90,416,228 | 90416228 | $132,219,407 | 132219407 | $-41,803,179 | -41803179 |
| 2017 | $95,375,786 | 95375786 | $137,302,894 | 137302894 | $-41,927,108 | -41927108 |
| 2018 | $101,337,500 | 101337500 | $136,929,168 | 136929168 | $-35,591,668 | -35591668 |
| 2019 | $127,218,214 | 127218214 | $136,944,257 | 136944257 | $-9,726,043 | -9726043 |
| 2020 | $145,670,792 | 145670792 | $140,677,788 | 140677788 | $4,993,004 | 4993004 |
| 2021 | $129,642,381 | 129642381 | $132,162,631 | 132162631 | $-2,520,250 | -2520250 |
| 2022 | $107,955,000 | 107955000 | $149,374,046 | 149374046 | $-41,419,046 | -41419046 |
| 2023 | $94,198,333 | 94198333 | $160,460,390 | 160460390 | $-66,262,057 | -66262057 |
| 2024 | $100,758,333 | 100758333 | $135,504,022 | 135504022 | $-34,745,689 | -34745689 |
| 2025 | $74,483,333 | 74483333 | $96,417,302 | 96417302 | $-21,933,969 | -21933969 |
| 2026 | $45,483,333 | 45483333 | $76,694,120 | 76694120 | $-31,210,787 | -31210787 |
| 2027 | $42,483,333 | 42483333 | $58,935,617 | 58935617 | $-16,452,284 | -16452284 |
| 2028 | $16,333,333 | 16333333 | $45,437,759 | 45437759 | $-29,104,426 | -29104426 |
| 2029 | $2,000,000 | 2000000 | $37,269,628 | 37269628 | $-35,269,628 | -35269628 |
|
 2006 Cincinnati Reds