| Player | Player Sort | Pos | Salary | Salary Sort | Pct | Pct Sort | WARP | WARP Sort | WARP/$M | WARP/$M Sort | $/WARP | $/WARP Sort | Current Status |
|---|
 Ken Griffey Jr.
 |
Griffey Ken |
CF |
$12,500,000 |
12500000 |
26.06% |
26.06 |
1.52 |
1.52247 |
0.12 |
0.1217976 |
$8,210,342 |
8210342.4041196 |
|
 Barry Larkin
 |
Larkin Barry |
SS |
$9,000,000 |
9000000 |
18.76% |
18.76 |
0.80 |
0.797552 |
0.09 |
0.088616888888889 |
$11,284,531 |
11284530.663831 |
|
 Pete Harnisch
 |
Harnisch Pete |
RP |
$3,750,000 |
3750000 |
7.82% |
7.82 |
-0.58 |
-0.575208 |
— |
0 |
— |
0 |
|
 Dmitri Young
 |
Young Dmitri |
LF |
$3,500,000 |
3500000 |
7.30% |
7.30 |
1.73 |
1.72724 |
0.49 |
0.49349714285714 |
$2,026,354 |
2026354.183553 |
|
 Pokey Reese
 |
Reese Pokey |
SS |
$3,200,000 |
3200000 |
6.67% |
6.67 |
1.72 |
1.71621 |
0.54 |
0.536315625 |
$1,864,574 |
1864573.6827078 |
|
 Sean Casey
 |
Casey Sean |
1B |
$3,000,000 |
3000000 |
6.25% |
6.25 |
1.19 |
1.1945 |
0.40 |
0.39816666666667 |
$2,511,511 |
2511511.0925073 |
|
 Danny Graves
 |
Graves Danny |
RP |
$2,100,000 |
2100000 |
4.38% |
4.38 |
1.05 |
1.05163 |
0.50 |
0.50077619047619 |
$1,996,900 |
1996900.050398 |
|
 Michael Tucker
 |
Tucker Michael |
LF |
$1,800,000 |
1800000 |
3.75% |
3.75 |
-0.14 |
-0.140552 |
— |
0 |
— |
0 |
|
 Scott Sullivan
 |
Sullivan Scott |
RP |
$1,700,000 |
1700000 |
3.54% |
3.54 |
0.51 |
0.511539 |
0.30 |
0.30090529411765 |
$3,323,305 |
3323304.7724611 |
|
 Alex Ochoa
 |
Ochoa Alex |
RF |
$1,600,000 |
1600000 |
3.34% |
3.34 |
1.25 |
1.25097 |
0.78 |
0.78185625 |
$1,279,007 |
1279007.4901876 |
|
 Ruben Rivera
 |
Rivera Ruben |
CF |
$1,000,000 |
1000000 |
2.08% |
2.08 |
0.90 |
0.896453 |
0.90 |
0.896453 |
$1,115,507 |
1115507.4499165 |
|
 Dennys Reyes
 |
Reyes Dennys |
RP |
$625,000 |
625000 |
1.30% |
1.30 |
-0.05 |
-0.0496593 |
— |
0 |
— |
0 |
|
 Mark Wohlers
 |
Wohlers Mark |
RP |
$500,000 |
500000 |
1.04% |
1.04 |
0.55 |
0.546267 |
1.09 |
1.092534 |
$915,303 |
915303.322368 |
|
 Kelly Stinnett
 |
Stinnett Kelly |
C |
$500,000 |
500000 |
1.04% |
1.04 |
0.85 |
0.852411 |
1.70 |
1.704822 |
$586,572 |
586571.50130629 |
|
 Elmer Dessens
 |
Dessens Elmer |
RP |
$475,000 |
475000 |
0.99% |
0.99 |
1.73 |
1.7319 |
3.65 |
3.6461052631579 |
$274,265 |
274265.25780934 |
|
 Juan Castro
 |
Castro Juan |
SS |
$400,000 |
400000 |
0.83% |
0.83 |
-1.74 |
-1.74004 |
— |
0 |
— |
0 |
|
 Scott Williamson
 |
Williamson Scott |
RP |
$400,000 |
400000 |
0.83% |
0.83 |
-0.02 |
-0.0185703 |
— |
0 |
— |
0 |
|
 Aaron Boone
 |
Boone Aaron |
3B |
$400,000 |
400000 |
0.83% |
0.83 |
2.99 |
2.99381 |
7.48 |
7.484525 |
$133,609 |
133609.01326403 |
|
 Wilton Guerrero
 |
Guerrero Wilton |
PH |
$400,000 |
400000 |
0.83% |
0.83 |
0.24 |
0.241782 |
0.60 |
0.604455 |
$1,654,383 |
1654382.8738285 |
|
 Rob Bell
 |
Bell Rob |
RP |
$250,000 |
250000 |
0.52% |
0.52 |
-0.51 |
-0.514579 |
— |
0 |
— |
0 |
|
 Jason LaRue
 |
LaRue Jason |
C |
$235,000 |
235000 |
0.49% |
0.49 |
0.24 |
0.241943 |
1.03 |
1.0295446808511 |
$971,303 |
971303.15818189 |
|
 Donnie Sadler
 |
Sadler Donnie |
2B |
$225,000 |
225000 |
0.47% |
0.47 |
-0.25 |
-0.253751 |
— |
0 |
— |
0 |
|
 John Riedling
 |
Riedling John |
RP |
$214,000 |
214000 |
0.45% |
0.45 |
0.24 |
0.241061 |
1.13 |
1.126453271028 |
$887,742 |
887742.10676966 |
|
 Chris Reitsma
 |
Reitsma Chris |
RP |
$200,000 |
200000 |
0.42% |
0.42 |
0.71 |
0.708954 |
3.54 |
3.54477 |
$282,106 |
282105.75016151 |
|
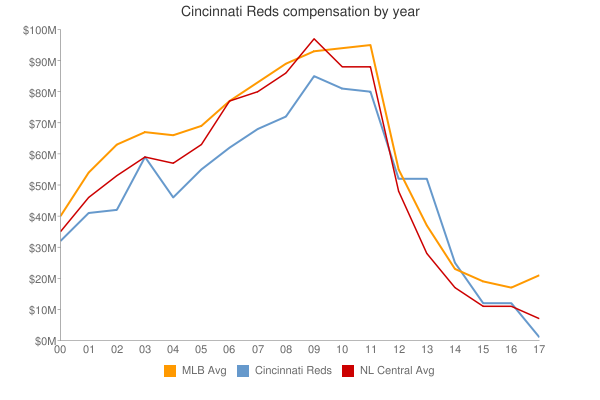
| Year | Reds payroll |
PR Sort |
Avg payroll |
AvgPR Sort |
Diff |
Diff Sort |
|---|
| 2000 | $44,767,200 | 44767200 | $55,368,142 | 55368142 | $-10,600,942 | -10600942 |
| 2001 | $47,974,000 | 47974000 | $64,937,084 | 64937084 | $-16,963,084 | -16963084 |
| 2002 | $43,203,890 | 43203890 | $67,238,672 | 67238672 | $-24,034,782 | -24034782 |
| 2003 | $58,541,000 | 58541000 | $70,654,480 | 70654480 | $-12,113,480 | -12113480 |
| 2004 | $46,697,250 | 46697250 | $69,466,729 | 69466729 | $-22,769,479 | -22769479 |
| 2005 | $62,594,583 | 62594583 | $74,114,841 | 74114841 | $-11,520,258 | -11520258 |
| 2006 | $63,631,833 | 63631833 | $79,621,815 | 79621815 | $-15,989,982 | -15989982 |
| 2007 | $69,910,833 | 69910833 | $85,537,470 | 85537470 | $-15,626,637 | -15626637 |
| 2008 | $72,240,000 | 72240000 | $92,003,799 | 92003799 | $-19,763,799 | -19763799 |
| 2009 | $72,283,500 | 72283500 | $92,169,598 | 92169598 | $-19,886,098 | -19886098 |
| 2010 | $76,876,500 | 76876500 | $94,342,601 | 94342601 | $-17,466,101 | -17466101 |
| 2011 | $76,631,134 | 76631134 | $96,974,710 | 96974710 | $-20,343,576 | -20343576 |
| 2012 | $87,826,167 | 87826167 | $100,947,217 | 100947217 | $-13,121,050 | -13121050 |
| 2013 | $111,105,533 | 111105533 | $108,586,966 | 108586966 | $2,518,567 | 2518567 |
| 2014 | $115,384,724 | 115384724 | $117,131,361 | 117131361 | $-1,746,637 | -1746637 |
| 2015 | $115,373,953 | 115373953 | $126,168,161 | 126168161 | $-10,794,208 | -10794208 |
| 2016 | $90,416,228 | 90416228 | $131,756,569 | 131756569 | $-41,340,341 | -41340341 |
| 2017 | $95,375,786 | 95375786 | $136,337,445 | 136337445 | $-40,961,659 | -40961659 |
| 2018 | $101,337,500 | 101337500 | $135,360,600 | 135360600 | $-34,023,100 | -34023100 |
| 2019 | $127,218,214 | 127218214 | $134,792,134 | 134792134 | $-7,573,920 | -7573920 |
| 2020 | $145,670,792 | 145670792 | $139,496,467 | 139496467 | $6,174,325 | 6174325 |
| 2021 | $129,642,381 | 129642381 | $130,712,288 | 130712288 | $-1,069,907 | -1069907 |
| 2022 | $107,955,000 | 107955000 | $149,802,695 | 149802695 | $-41,847,695 | -41847695 |
| 2023 | $94,198,333 | 94198333 | $161,692,345 | 161692345 | $-67,494,012 | -67494012 |
| 2024 | $100,758,333 | 100758333 | $136,306,249 | 136306249 | $-35,547,916 | -35547916 |
| 2025 | $74,483,333 | 74483333 | $98,329,527 | 98329527 | $-23,846,194 | -23846194 |
| 2026 | $45,483,333 | 45483333 | $78,039,273 | 78039273 | $-32,555,940 | -32555940 |
| 2027 | $42,483,333 | 42483333 | $60,919,343 | 60919343 | $-18,436,010 | -18436010 |
| 2028 | $16,333,333 | 16333333 | $46,901,712 | 46901712 | $-30,568,379 | -30568379 |
| 2029 | $2,000,000 | 2000000 | $38,597,944 | 38597944 | $-36,597,944 | -36597944 |
|
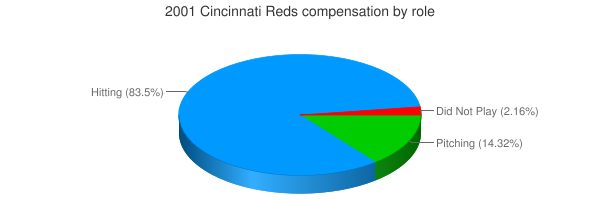
 2001 Cincinnati Reds