| Player | Player Sort | Pos | Salary | Salary Sort | Pct | Pct Sort | WARP | WARP Sort | WARP/$M | WARP/$M Sort | $/WARP | $/WARP Sort | Current Status |
|---|
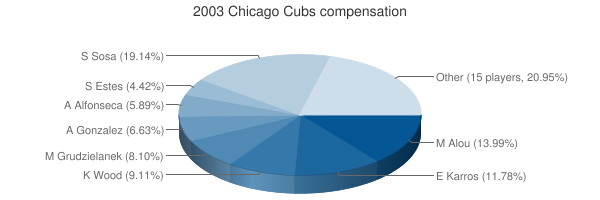
 Sammy Sosa
 |
Sosa Sammy |
RF |
$13,000,000 |
13000000 |
16.29% |
16.29 |
1.97 |
1.96608 |
0.15 |
0.15123692307692 |
$6,612,142 |
6612141.9270833 |
|
 Moises Alou
 |
Alou Moises |
LF |
$9,500,000 |
9500000 |
11.90% |
11.90 |
0.45 |
0.450914 |
0.05 |
0.047464631578947 |
$21,068,319 |
21068319.014269 |
|
 Eric Karros
 |
Karros Eric |
1B |
$8,000,000 |
8000000 |
10.02% |
10.02 |
-0.75 |
-0.747594 |
— |
0 |
— |
0 |
|
 Kerry Wood
 |
Wood Kerry |
RP |
$6,190,000 |
6190000 |
7.76% |
7.76 |
7.65 |
7.6518 |
1.24 |
1.236155088853 |
$808,960 |
808959.98327191 |
|
 Alex Gonzalez
 |
Gonzalez Alex |
SS |
$5,750,000 |
5750000 |
7.21% |
7.21 |
1.50 |
1.49931 |
0.26 |
0.26074956521739 |
$3,835,097 |
3835097.4781733 |
|
 Mark Grudzielanek
 |
Grudzielanek Mark |
2B |
$5,500,000 |
5500000 |
6.89% |
6.89 |
3.00 |
3.00199 |
0.55 |
0.54581636363636 |
$1,832,118 |
1832118.0283745 |
FA/2011 |
 Jon Lieber
 |
Lieber Jon |
DNP |
$5,500,000 |
5500000 |
6.89% |
6.89 |
— |
0.00 |
— |
0 |
— |
0 |
|
 Antonio Alfonseca
 |
Alfonseca Antonio |
RP |
$4,000,000 |
4000000 |
5.01% |
5.01 |
0.50 |
0.504711 |
0.13 |
0.12617775 |
$7,925,328 |
7925327.5636949 |
|
 Matt Clement
 |
Clement Matt |
RP |
$4,000,000 |
4000000 |
5.01% |
5.01 |
5.30 |
5.30478 |
1.33 |
1.326195 |
$754,037 |
754036.92518823 |
|
 Shawn Estes
 |
Estes Shawn |
RP |
$3,000,000 |
3000000 |
3.76% |
3.76 |
-1.01 |
-1.01488 |
— |
0 |
— |
0 |
|
 Damian Miller
 |
Miller Damian |
C |
$2,700,000 |
2700000 |
3.38% |
3.38 |
0.05 |
0.0479135 |
0.02 |
0.017745740740741 |
$56,351,550 |
56351550.189404 |
|
 Mike Remlinger
 |
Remlinger Mike |
RP |
$2,300,000 |
2300000 |
2.88% |
2.88 |
1.59 |
1.59157 |
0.69 |
0.69198695652174 |
$1,445,114 |
1445113.9440929 |
|
 Dave Veres
 |
Veres Dave |
RP |
$2,000,000 |
2000000 |
2.51% |
2.51 |
0.55 |
0.553297 |
0.28 |
0.2766485 |
$3,614,695 |
3614695.1817921 |
|
 Mark Guthrie
 |
Guthrie Mark |
RP |
$1,600,000 |
1600000 |
2.00% |
2.00 |
-0.51 |
-0.51423 |
— |
0 |
— |
0 |
|
 Mark Prior
 |
Prior Mark |
RP |
$1,450,000 |
1450000 |
1.82% |
1.82 |
8.63 |
8.62907 |
5.95 |
5.9510827586207 |
$168,037 |
168036.64821354 |
|
 Lenny Harris
 |
Harris Lenny |
PH |
$800,000 |
800000 |
1.00% |
1.00 |
-1.05 |
-1.05368 |
— |
0 |
— |
0 |
|
 Paul Bako
 |
Bako Paul |
C |
$750,000 |
750000 |
0.94% |
0.94 |
0.63 |
0.625117 |
0.83 |
0.83348933333333 |
$1,199,775 |
1199775.4020447 |
|
 Tom Goodwin
 |
Goodwin Tom |
PH |
$635,000 |
635000 |
0.80% |
0.80 |
0.09 |
0.0909452 |
0.14 |
0.14322078740157 |
$6,982,227 |
6982226.6595708 |
|
 Kyle Farnsworth
 |
Farnsworth Kyle |
RP |
$600,000 |
600000 |
0.75% |
0.75 |
2.23 |
2.22703 |
3.71 |
3.7117166666667 |
$269,417 |
269417.11606938 |
|
 Mark Bellhorn
 |
Bellhorn Mark |
3B |
$465,000 |
465000 |
0.58% |
0.58 |
0.31 |
0.305874 |
0.66 |
0.6577935483871 |
$1,520,234 |
1520233.8217697 |
|
 Joe Borowski
 |
Borowski Joe |
RP |
$410,000 |
410000 |
0.51% |
0.51 |
1.76 |
1.76081 |
4.29 |
4.2946585365854 |
$232,847 |
232847.38273863 |
|
 Corey Patterson
 |
Patterson Corey |
CF |
$365,000 |
365000 |
0.46% |
0.46 |
0.91 |
0.910298 |
2.49 |
2.4939671232877 |
$400,968 |
400967.59522706 |
|
 Carlos Zambrano
 |
Zambrano Carlos |
RP |
$340,000 |
340000 |
0.43% |
0.43 |
5.81 |
5.81369 |
17.10 |
17.099088235294 |
$58,483 |
58482.650433718 |
|
 Juan Cruz
 |
Cruz Juan |
RP |
$340,000 |
340000 |
0.43% |
0.43 |
1.44 |
1.44242 |
4.24 |
4.2424117647059 |
$235,715 |
235714.97899364 |
|
 Scott Chiasson
 |
Chiasson Scott |
DNP |
$305,000 |
305000 |
0.38% |
0.38 |
— |
0.00 |
— |
0 |
— |
0 |
|
 Hee-Seop Choi
 |
Choi Hee-Seop |
1B |
$305,000 |
305000 |
0.38% |
0.38 |
0.78 |
0.776066 |
2.54 |
2.5444786885246 |
$393,008 |
393007.81119132 |
|
| Year | Cubs payroll |
PR Sort |
Avg payroll |
AvgPR Sort |
Diff |
Diff Sort |
|---|
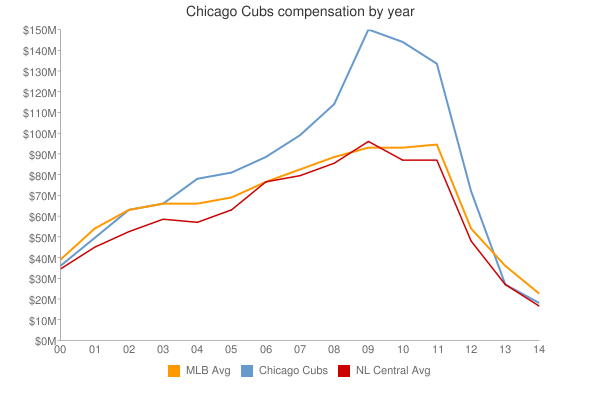
| 2000 | $61,584,333 | 61584333 | $55,368,142 | 55368142 | $6,216,191 | 6216191 |
| 2001 | $64,315,833 | 64315833 | $64,937,084 | 64937084 | $-621,251 | -621251 |
| 2002 | $74,959,833 | 74959833 | $67,238,672 | 67238672 | $7,721,161 | 7721161 |
| 2003 | $79,805,000 | 79805000 | $70,654,480 | 70654480 | $9,150,520 | 9150520 |
| 2004 | $89,226,667 | 89226667 | $69,466,729 | 69466729 | $19,759,938 | 19759938 |
| 2005 | $85,064,767 | 85064767 | $74,114,841 | 74114841 | $10,949,926 | 10949926 |
| 2006 | $93,257,833 | 93257833 | $79,621,815 | 79621815 | $13,636,018 | 13636018 |
| 2007 | $99,285,666 | 99285666 | $85,537,470 | 85537470 | $13,748,196 | 13748196 |
| 2008 | $120,270,833 | 120270833 | $92,003,799 | 92003799 | $28,267,034 | 28267034 |
| 2009 | $135,142,333 | 135142333 | $92,169,598 | 92169598 | $42,972,735 | 42972735 |
| 2010 | $143,359,000 | 143359000 | $94,342,601 | 94342601 | $49,016,399 | 49016399 |
| 2011 | $134,329,000 | 134329000 | $96,974,710 | 96974710 | $37,354,290 | 37354290 |
| 2012 | $111,034,202 | 111034202 | $100,947,217 | 100947217 | $10,086,985 | 10086985 |
| 2013 | $107,375,524 | 107375524 | $108,586,966 | 108586966 | $-1,211,442 | -1211442 |
| 2014 | $92,677,368 | 92677368 | $117,131,361 | 117131361 | $-24,453,993 | -24453993 |
| 2015 | $120,337,385 | 120337385 | $126,168,161 | 126168161 | $-5,830,776 | -5830776 |
| 2016 | $171,611,832 | 171611832 | $131,756,569 | 131756569 | $39,855,263 | 39855263 |
| 2017 | $172,199,881 | 172199881 | $136,337,445 | 136337445 | $35,862,436 | 35862436 |
| 2018 | $183,156,139 | 183156139 | $135,360,600 | 135360600 | $47,795,539 | 47795539 |
| 2019 | $214,246,988 | 214246988 | $134,792,134 | 134792134 | $79,454,854 | 79454854 |
| 2020 | $188,459,500 | 188459500 | $139,496,467 | 139496467 | $48,963,033 | 48963033 |
| 2021 | $152,542,000 | 152542000 | $130,712,288 | 130712288 | $21,829,712 | 21829712 |
| 2022 | $140,736,000 | 140736000 | $149,802,695 | 149802695 | $-9,066,695 | -9066695 |
| 2023 | $185,159,250 | 185159250 | $161,692,345 | 161692345 | $23,466,905 | 23466905 |
| 2024 | $192,295,000 | 192295000 | $136,306,249 | 136306249 | $55,988,751 | 55988751 |
| 2025 | $141,750,000 | 141750000 | $98,329,527 | 98329527 | $43,420,473 | 43420473 |
| 2026 | $136,250,000 | 136250000 | $78,039,273 | 78039273 | $58,210,727 | 58210727 |
| 2027 | $43,250,000 | 43250000 | $60,919,343 | 60919343 | $-17,669,343 | -17669343 |
| 2028 | $27,000,000 | 27000000 | $46,901,712 | 46901712 | $-19,901,712 | -19901712 |
| 2029 | $26,000,000 | 26000000 | $38,597,944 | 38597944 | $-12,597,944 | -12597944 |
|
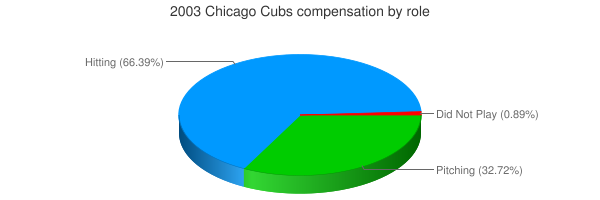
 2003 Chicago Cubs