| Player | Player Sort | Pos | Salary | Salary Sort | Pct | Pct Sort | WARP | WARP Sort | WARP/$M | WARP/$M Sort | $/WARP | $/WARP Sort | Current Status |
|---|
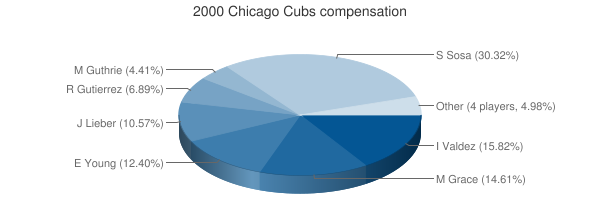
 Sammy Sosa
 |
Sosa Sammy |
RF |
$11,000,000 |
11000000 |
17.86% |
17.86 |
5.30 |
5.29992 |
0.48 |
0.48181090909091 |
$2,075,503 |
2075503.0264608 |
|
 Kevin Tapani
 |
Tapani Kevin |
RP |
$6,000,000 |
6000000 |
9.74% |
9.74 |
5.54 |
5.53877 |
0.92 |
0.92312833333333 |
$1,083,273 |
1083273.0010454 |
|
 Ismael Valdez
 |
Valdez Ismael |
RP |
$5,737,500 |
5737500 |
9.32% |
9.32 |
0.82 |
0.819124 |
0.14 |
0.14276671023965 |
$7,004,434 |
7004434.0051079 |
|
 Mark Grace
 |
Grace Mark |
1B |
$5,300,000 |
5300000 |
8.61% |
8.61 |
2.17 |
2.16686 |
0.41 |
0.40884150943396 |
$2,445,936 |
2445935.5934394 |
|
 Henry Rodriguez
 |
Rodriguez Henry |
LF |
$4,600,000 |
4600000 |
7.47% |
7.47 |
-0.20 |
-0.204759 |
— |
0 |
— |
0 |
|
 Eric Young
 |
Young Eric |
2B |
$4,500,000 |
4500000 |
7.31% |
7.31 |
2.99 |
2.98935 |
0.66 |
0.6643 |
$1,505,344 |
1505343.9710974 |
|
 Jon Lieber
 |
Lieber Jon |
RP |
$3,833,333 |
3833333 |
6.22% |
6.22 |
8.27 |
8.26664 |
2.16 |
2.1565149701317 |
$463,711 |
463711.13293914 |
|
 Rick Aguilera
 |
Aguilera Rick |
RP |
$3,500,000 |
3500000 |
5.68% |
5.68 |
0.70 |
0.702484 |
0.20 |
0.20070971428571 |
$4,982,320 |
4982319.8820187 |
|
 Ricky Gutierrez
 |
Gutierrez Ricky |
SS |
$2,500,000 |
2500000 |
4.06% |
4.06 |
0.76 |
0.759802 |
0.30 |
0.3039208 |
$3,290,331 |
3290330.9019982 |
|
 Damon Buford
 |
Buford Damon |
CF |
$2,200,000 |
2200000 |
3.57% |
3.57 |
0.24 |
0.239364 |
0.11 |
0.10880181818182 |
$9,191,023 |
9191022.8772915 |
|
 Joe Girardi
 |
Girardi Joe |
C |
$2,000,000 |
2000000 |
3.25% |
3.25 |
0.10 |
0.0987788 |
0.05 |
0.0493894 |
$20,247,260 |
20247259.533422 |
|
 Mark Guthrie
 |
Guthrie Mark |
RP |
$1,600,000 |
1600000 |
2.60% |
2.60 |
0.33 |
0.329648 |
0.21 |
0.20603 |
$4,853,662 |
4853662.0880454 |
|
 Glenallen Hill
 |
Hill Glenallen |
LF |
$1,500,000 |
1500000 |
2.44% |
2.44 |
0.30 |
0.296319 |
0.20 |
0.197546 |
$5,062,112 |
5062112.1156591 |
|
 Shane Andrews
 |
Andrews Shane |
3B |
$1,000,000 |
1000000 |
1.62% |
1.62 |
0.15 |
0.148845 |
0.15 |
0.148845 |
$6,718,398 |
6718398.3338372 |
|
 Jeff Reed
 |
Reed Jeff |
C |
$1,000,000 |
1000000 |
1.62% |
1.62 |
0.47 |
0.4734 |
0.47 |
0.4734 |
$2,112,379 |
2112378.5382341 |
|
 Matt Karchner
 |
Karchner Matt |
RP |
$776,000 |
776000 |
1.26% |
1.26 |
-0.26 |
-0.261572 |
— |
0 |
— |
0 |
|
 Kerry Wood
 |
Wood Kerry |
RP |
$690,000 |
690000 |
1.12% |
1.12 |
2.67 |
2.67137 |
3.87 |
3.8715507246377 |
$258,294 |
258294.43319346 |
|
 Felix Heredia
 |
Heredia Felix |
RP |
$625,000 |
625000 |
1.01% |
1.01 |
0.35 |
0.34706 |
0.56 |
0.555296 |
$1,800,841 |
1800841.3530802 |
|
 Brian Williams
 |
Williams Brian |
RP |
$600,000 |
600000 |
0.97% |
0.97 |
-0.70 |
-0.698632 |
— |
0 |
— |
0 |
|
 Chris Haney
 |
Haney Chris |
DNP |
$500,000 |
500000 |
0.81% |
0.81 |
— |
0.00 |
— |
0 |
— |
0 |
|
 Willie Greene
 |
Greene Willie |
3B |
$395,000 |
395000 |
0.64% |
0.64 |
0.06 |
0.0550464 |
0.14 |
0.13935797468354 |
$7,175,764 |
7175764.4459947 |
|
 Jeff Huson
 |
Huson Jeff |
PH |
$300,000 |
300000 |
0.49% |
0.49 |
-0.45 |
-0.445435 |
— |
0 |
— |
0 |
|
 Geremi Gonzalez
 |
Gonzalez Geremi |
DNP |
$265,000 |
265000 |
0.43% |
0.43 |
— |
0.00 |
— |
0 |
— |
0 |
|
 Chad Fox
 |
Fox Chad |
DNP |
$255,000 |
255000 |
0.41% |
0.41 |
— |
0.00 |
— |
0 |
— |
0 |
|
 Andrew Lorraine
 |
Lorraine Andrew |
RP |
$245,000 |
245000 |
0.40% |
0.40 |
-0.20 |
-0.197893 |
— |
0 |
— |
0 |
|
 Kyle Farnsworth
 |
Farnsworth Kyle |
RP |
$235,000 |
235000 |
0.38% |
0.38 |
0.36 |
0.363163 |
1.55 |
1.5453744680851 |
$647,092 |
647092.35246983 |
|
 Jose Nieves
 |
Nieves Jose |
3B |
$217,500 |
217500 |
0.35% |
0.35 |
-0.88 |
-0.88325 |
— |
0 |
— |
0 |
|
 Roosevelt Brown
 |
Brown Roosevelt |
LF |
$210,000 |
210000 |
0.34% |
0.34 |
0.36 |
0.355315 |
1.69 |
1.6919761904762 |
$591,025 |
591024.8652604 |
|
| Year | Cubs payroll |
PR Sort |
Avg payroll |
AvgPR Sort |
Diff |
Diff Sort |
|---|
| 2000 | $61,584,333 | 61584333 | $55,368,142 | 55368142 | $6,216,191 | 6216191 |
| 2001 | $64,315,833 | 64315833 | $64,937,084 | 64937084 | $-621,251 | -621251 |
| 2002 | $74,959,833 | 74959833 | $67,238,672 | 67238672 | $7,721,161 | 7721161 |
| 2003 | $79,805,000 | 79805000 | $70,654,480 | 70654480 | $9,150,520 | 9150520 |
| 2004 | $89,226,667 | 89226667 | $69,466,729 | 69466729 | $19,759,938 | 19759938 |
| 2005 | $85,064,767 | 85064767 | $74,114,841 | 74114841 | $10,949,926 | 10949926 |
| 2006 | $93,257,833 | 93257833 | $79,621,815 | 79621815 | $13,636,018 | 13636018 |
| 2007 | $99,285,666 | 99285666 | $85,537,470 | 85537470 | $13,748,196 | 13748196 |
| 2008 | $120,270,833 | 120270833 | $92,003,799 | 92003799 | $28,267,034 | 28267034 |
| 2009 | $135,142,333 | 135142333 | $92,169,598 | 92169598 | $42,972,735 | 42972735 |
| 2010 | $143,359,000 | 143359000 | $94,342,601 | 94342601 | $49,016,399 | 49016399 |
| 2011 | $134,329,000 | 134329000 | $96,974,710 | 96974710 | $37,354,290 | 37354290 |
| 2012 | $111,034,202 | 111034202 | $100,947,217 | 100947217 | $10,086,985 | 10086985 |
| 2013 | $107,375,524 | 107375524 | $108,586,966 | 108586966 | $-1,211,442 | -1211442 |
| 2014 | $92,677,368 | 92677368 | $117,131,361 | 117131361 | $-24,453,993 | -24453993 |
| 2015 | $120,337,385 | 120337385 | $126,168,161 | 126168161 | $-5,830,776 | -5830776 |
| 2016 | $171,611,832 | 171611832 | $131,756,569 | 131756569 | $39,855,263 | 39855263 |
| 2017 | $172,199,881 | 172199881 | $136,337,445 | 136337445 | $35,862,436 | 35862436 |
| 2018 | $183,156,139 | 183156139 | $135,360,600 | 135360600 | $47,795,539 | 47795539 |
| 2019 | $214,246,988 | 214246988 | $134,792,134 | 134792134 | $79,454,854 | 79454854 |
| 2020 | $188,459,500 | 188459500 | $139,496,467 | 139496467 | $48,963,033 | 48963033 |
| 2021 | $152,542,000 | 152542000 | $130,712,288 | 130712288 | $21,829,712 | 21829712 |
| 2022 | $140,736,000 | 140736000 | $149,802,695 | 149802695 | $-9,066,695 | -9066695 |
| 2023 | $185,159,250 | 185159250 | $161,692,345 | 161692345 | $23,466,905 | 23466905 |
| 2024 | $192,295,000 | 192295000 | $136,306,249 | 136306249 | $55,988,751 | 55988751 |
| 2025 | $141,750,000 | 141750000 | $98,329,527 | 98329527 | $43,420,473 | 43420473 |
| 2026 | $136,250,000 | 136250000 | $78,039,273 | 78039273 | $58,210,727 | 58210727 |
| 2027 | $43,250,000 | 43250000 | $60,919,343 | 60919343 | $-17,669,343 | -17669343 |
| 2028 | $27,000,000 | 27000000 | $46,901,712 | 46901712 | $-19,901,712 | -19901712 |
| 2029 | $26,000,000 | 26000000 | $38,597,944 | 38597944 | $-12,597,944 | -12597944 |
|
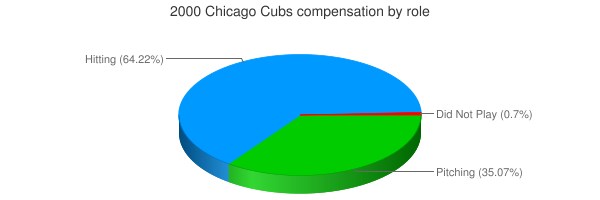
 2000 Chicago Cubs