 42 comments have been left for this article.
 BP Comment Quick Links

|

|
January 29, 2010 Getting Out of the ZoneA New Way of Looking at Defense
Let's get defensive. Probably the simplest defensive metric available that's of any practical utility is Defensive Efficiency Rating, a Bill James creation. Simply put, DER is:  If you want to calculate it from official offensive statistics, you can figure it as: 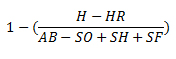 In other words, it is one minus Batting Average on Balls In Play (BABIP). It's actually quite a clever concept, and it does a fairly good job of measuring defense. The big problem is simply that it tells us a lot about a team, but very little about the players on the team. Now, let's think about this for a minute. By all rights, individual player defense should add up to team defense. Let us, for the moment, tackle a portion of the issue for the sake of clarity: For right now, we're only looking at ground-ball defense. And let's (for the time being) ignore balls fielded by the pitcher and catcher. Throw them out on both sides of the equation. And pretend for just a moment that all four of our infielders are newly minted Cal Ripken Jr. clones, and they play every game. Now, let's take our DER and try and break it up into components: 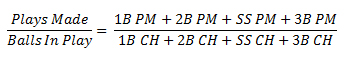 "PM" stands for "plays made," and "CH" stands for chances. In short, what we're trying to do is split up balls in play and "credit" them to the individual fielders to produce each player's individual DER. Can we do this? The simple part (assuming one has play-by-play data) is figuring out each fielder's plays made. In the infield, a play is made when the player fielding the ball is credited with either a putout or an assist. (In some rare circumstances-mostly when a missed catch error is committed-this occurs even when there is no out recorded on the play.) For the outfield, a play is made when the player fielding the ball is credited with a putout. An outfield assist is generally what we refer to as a "baserunner kill," an important part of the puzzle, but something that's better measured by an arm rating rather than including it in a range-based fielding metric. We'll swing back around to looking at outfielder arms eventually, though. So we can apportion out fielding plays made between fielders pretty readily. What can we do about splitting up balls in plays into fielding chances? For that, we need to look at where the ball is hit on the field. The Danger Zone Typically, when looking at balls in play, dividing the field into zones indicates the hit location, like so: 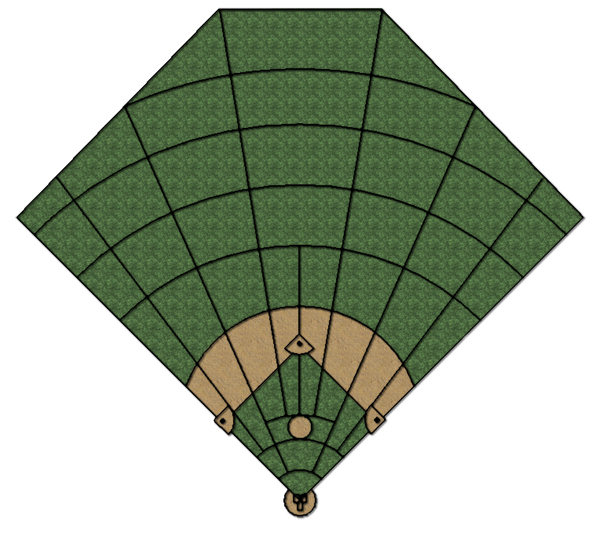 This particular zone diagram is adapted from the Project Scoresheet scorekeeping system; different data providers adopt different zone systems, and the specifics of each zone aren't really important right now. The location of where a ball is hit on the field is recorded based upon whatever zone it's hit in. For ground balls, it's typically recorded as the zone where it passed through the infield, regardless of where the ball eventually ends up. So when we want to determine something about a ball in play, using its zone location and batted-ball type, we can compare it to its peer group. But let's consider a specific example: 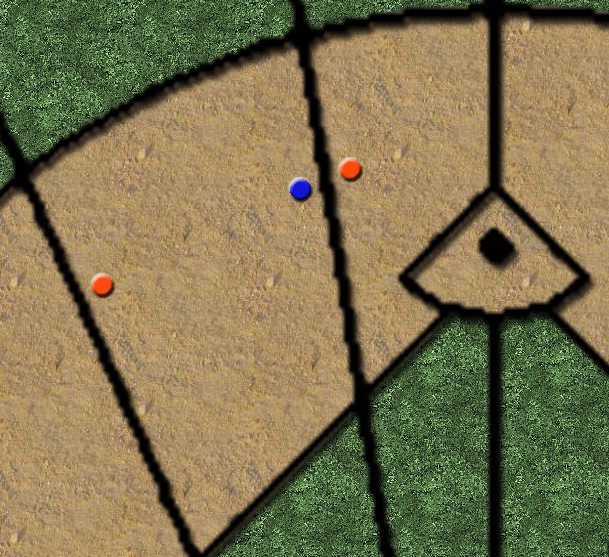 Suppose we're interested in the ball indicated by the blue dot in that diagram. In a zone-based system, that particular fielding play would end up being compared to the play indicated by the red dot on the far left, but not the play represented by the red dot right next to it on the field. Of course we can always divide into smaller and smaller zones to address this issue. But you end up slicing your sample smaller and smaller, making yourself more susceptible to random variation. And you're always going to end up with an arbitrary distinction between what batted balls are peers and what aren't. So, rather than dividing the field into zones, what can we do? Instead, let's compare every batted ball to all other batted balls. Let's simply weigh the closest ones more heavily. Say we describe every batted ball, not by a zone, but by an angle, where home plate is the origin, a straight line out to second base is zero degrees, first base is 45 degrees, and third base is -45 degrees. If we have a ball hit at 10 degrees (or just a bit to the right of second base), we can compare it to a ball hit at zero degrees and 20 degrees equally. A ball at -5 degrees can also be compared, but we put less emphasis on it in determining what it should be. To achieve this, we can use a tool known as local regression, also called a Loess or Lowess regression. Finding Chances Since we're dispensing with the idea of zones, we can also dispense with the notion that some fielding chances are "in zone" and fieldable and some are "out of zone" and unfieldable. All batted balls in play are fieldable; it's simply a matter of responsibility. So, to figure out who is responsible for each portion of the field, we are going to throw out hits and simply look at plays made for the time being. Essentially, we are trying to give out one chance per batted ball. We can certainly use fractional chances, though-some balls might be 50 percent the responsibility of the shortstop and 50 percent the responsibility of the second baseman, for instance. Using some local regressions, we can apportion out chances like so: 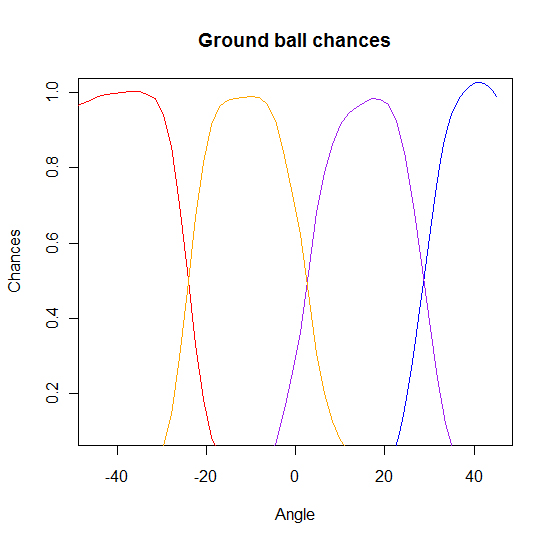 Blue represents first base, purple second base, orange shortstop, and red third base. That's still a little messy, especially along the foul lines-not everything adds up to one exactly as we would like. That's not entirely unexpected-the local fit is going to come with a standard error for each fitting point as well, and since we know the actual value, we can "push" everything in the right direction and get everything to add up correctly. So we've got what we came here for, right? I mean, we can figure out a DER for each fielder that aggregates to team DER, at least for ground balls. What we're missing here is that not all ground-ball chances are equal. So, before we can compare two players, we need to know not just the number of chances they had, but also the difficulty of those chances. What we want to look at is the expected outs made on each ball in play as well: 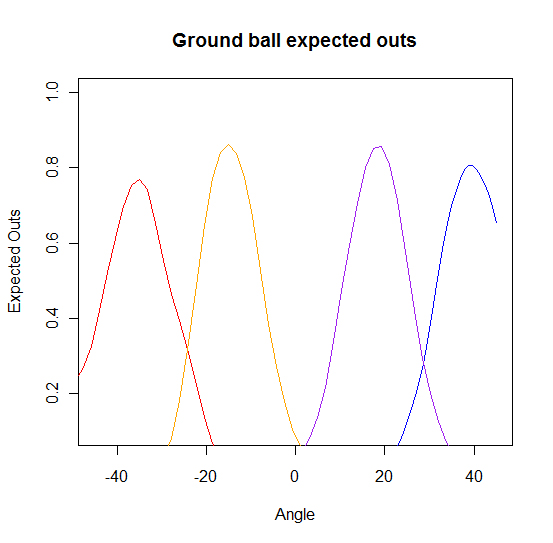 This time, not everything does-or should-come close to adding up to one. Particularly, you can see that a ball hit straight up the middle is rarely, if ever, converted into an out. Doing the Split All of the above works for figuring out responsibility on hits. But there's a caution when applying it to outs (or errors, for that matter). Once a ball is fielded, it is no longer a chance for any other fielder, and it shouldn't be counted against them. So, for any ball a player fields, they are credited with one chance, regardless of location. Since we are crediting the fielder with the entire chance, we also need to credit that fielder for the entire expected out as well, not just the expected out for his position: 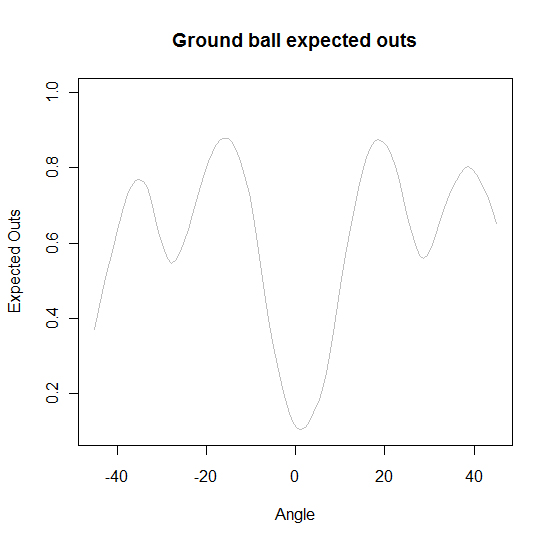 This is key for two reasons-it makes sure everything properly reconciles at the team level, and it avoids over-crediting a "ball hog" for stealing plays from his teammates. Putting it Together So, for every ball in play, we figure both a player's chances and their expected outs. A player's individual DER is:  And their expected DER is: 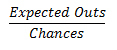 From here, we can compute a "normalized" individual DER for each player that controls for the difficulty of chances each player received. We can also subtract expected outs from plays made to figure a fielder's plays above (or below) average. This gives us a framework for evaluating the contributions of individual fielders. We're not quite ready to apply it to individual fielders, though. First, we need to account for a few other factors, such as baserunners, the number of outs, number of strikes, and park factors. We'll attend to those next week. Notes and Asides All regressions and graphs for the article were produced using GNU R with the locfit package, with a smoothing value of 0.2. Several existing fielding metrics served as an inspiration for this system, primarily Mitchel Lichtman's Ultimate Zone Rating and Shane Jensen's SAFE.
Colin Wyers is an author of Baseball Prospectus. Follow @cwyers
|
Interesting approach and it feels intuitive. I'm curious to see where this goes with more variables thrown in.