 125 comments have been left for this article.
 BP Comment Quick Links

|

|
January 11, 2010 How Do Baseball Players Age?Investigating the Age-27 Theory
Recently, there's been a decent amount of chatter regarding how baseball players age, and I have to admit that it's mostly my fault. In a study that was recently published in Journal of Sports Sciences, I find that players tend to peak around the age of 29; this finding has been met with resistance from some individuals in the sabermetric community, where 27 has long been considered the age when players peak. Will Carroll and Christina Kahrl graciously asked if I would be willing to defend my findings on Baseball Prospectus. I agreed, and I thank Will and Christina for the opportunity to do so. Due to the length of the explanation, I have broken the analysis into two parts. Part I explains the empirical problems faced when estimating aging, and examines why past sabermetric studies have failed to properly measure player aging; Part II explains my recent study. Part I. It Usually Begins with Bill James For the past few years, I've been investigating the financial worth of players for a book that will be coming out next winter. Valuing present performance is difficult enough, but players are normally under team control for several years rather than signing annual arrangements. Soon after I began this project, I realized that to understand player contracts I was going to have to gain a better understanding how players age. I found previous sabermetric studies to be instructive but deficient for reasons that I'll explain below. I also asked for guidance from my exercise physiologist colleagues who were familiar with the academic literature on aging and athletic performance. These studies were good, but did not account for several aspects unique to baseball, such as changes in baseball's competitive environment. Therefore, I decided to conduct my own study. Of course, my investigation began with Bill James. Like many baseball analysts, my first introduction to sabermetrics was through James. Nearly a decade ago, my colleague Doug Drinen pulled out his prized childhood collection of Bill James Baseball Abstracts for me to peruse, and I was awed by James's approach. In my mind, this was the economic way of thinking, applied to baseball. I doubt that is what James intended, but I remembered saying to Doug, "if I had stumbled on James when I was 12, it would have changed my life." Instead of having to wait until freshman economics before I was introduced to the lens through which I was already viewing the world, I could have learned about it through my favorite sport. Of the essays I read, James's "Looking for the Prime" always stuck with me, because of James's keen understanding of the difficulty in using baseball performance statistics to measure aging. The essay is most frequently referenced as a successful challenge the conventional wisdom that baseball players peak between 28 and 32, with James bluntly stating, "that one truism is blatantly false." James used his "Value Approximation Method" (VAM) to measure player performance by aggregating individual VAM ratings of players by age. He found that the player-age of 27 had the highest total performance of any other age and concluded, "If you must assign a five-year peak period to all players regardless of description, the best shot would be 25 to 29." But in hindsight, the evidence for this was actually quite weak. James would eventually abandon VAM because it was, in his own words, "ultimately undermined by the lack of logic behind it" (NBJHA, p. 338). Also, aggregating performance into age buckets is biased by the fact that many players play baseball in their mid-twenties before they wash out-these buckets are full because of the number of people at this age who play, not because they are so good. But even while taking the popular notion to task, James was quick to note that current studies of aging, including his own, suffered from a unique problem. When players are deemed to fall below major-league quality, they stop playing; therefore, we can't measure how their performance changes. He referred to this unobserved hypothetical performance as "white space." When we look at players who do play to measure aging, we have to keep this selection bias in mind. James's decision to aggregate total performance by age was done to avoid a problem that Pete Palmer, another prominent early sabermetrician, had run across in his own study of aging. Palmer had taken average performance of all players by age and found performance to be nearly flat across ages. The reason for this is not that players don't age, but that good players get to play when they are young and old, while marginal players do not; thus, the remaining good players make the tails look comparatively flat. Ultimately, James acknowledged that his own method didn't solve the problem, and left it as a question for future analysts to address: > I think that any successful statistical analysis of aging must find, and none of us has yet, some way to deal with "the white space." In the Palmer study, all the players within the white space are not counted; in the VAM study all players in the white space are counted at zero. Neither is correct (pp. 196 - 197). Two other methods have also been employed by sabermetricians attempting to quantify aging: the mode method, and the delta method. The mode method identifies the age at which players typically have their best season. While the mode age is a player's peak age by definition, it's inappropriate to assume that the most common age at which players have their best season is the pure product of aging. The mode peak age will likely lie below a player's expected peak, because there are two main factors that cause players to decline and leave the game: aging, and non-aging-related injuries. Injuries and age are correlated, but players also suffer performance declines that have nothing to do with age. For example, in 2008 Chien-Ming Wang severely damaged his foot while running the bases, and it's unlikely that Wang will pitch as well as he did when he was 27. This injury could have struck Wang just as easily at 24 or 36. Because players who wash out of baseball are normally replaced by young players, there will be many more players having their best season at a young age. When we look at the mode, we are not differentiating from the cause of deterioration, however; non-aging attrition gives more players the opportunity to have peak ages earlier than later. Studies that employ the mode to measure aging inadvertently pick up this bias, which has nothing to do with aging. The delta method looks at players in adjacent seasons to see how their performances change to measure aging, but this method suffers from a different type of bias. In order to play in consecutive seasons, a player must normally have a good first season. Players with bad seasons don't get an opportunity to be in the sample. Thus, many players who had lucky-good seasons will stay in the sample to decline the following year, but lucky-bad players won't get an opportunity to improve. The lucky-good deterioration will not be canceled out by lucky-bad improvements; therefore, this selection bias (which I call "the survivor effect") will exaggerate aging. Recently, Mitchel Lichtman used a modified delta-method approach to quantify aging that attempts to correct for the survivor effect. His solution was to include players who would typically be dropped from the sample (i.e., players who do not play in consecutive years) by assigning them hypothetical performances for the following year. This sounds good in theory, but where does this hypothetical performance come from? Lichtman explains: The projection is their last three years lwts per 500 PA, weighted by year (3/4/5) added to 500 PA of league average lwts for that age minus five. In other words, I am regressing their last three years lwts (weighted) toward five runs lower than a league average player for that age. While Lichtman believes using five runs below average generates a "conservative" projection, the substitution is just a guess informed by nothing more than a hunch. In this case, the guess imposes the outcome for the exact factor we are trying to measure: the estimated decline is a pure product of the assumption. Thus, it is no surprise that Lichtman's adjusted delta-method estimates yield results that differ little from his raw delta-method estimates. The good news is that we don't have to guess what players might have done; instead, we can look at how players who continue to play over several years age and not rely on snapshots of one-time annual changes. Such a sample has two advantages over the delta method. First, the fluctuations in player performance due to random noise-not aging-will be smoothed out over time to generate a trend. Second, and more importantly, it allows us to track individual players over time to see how each player progresses according to his own unique baseline. Doing this analysis requires using a multiple regression analysis technique that allows us to observe how a cross-section of players change over time, while controlling for other potential factors that affect performance but have nothing to do with age. Part II describes the study I conducted using this method and discusses its results. Part II. Looking for the Prime in a New Way In Part I, I identified problems with previous studies of aging that motivated me to conduct a new study on the subject; here, I explain the method in general terms. If you are curious about the technical details, they are available in my paper. The Sample I used an 86 years of baseball performance data from 1921 through 2006 to produce a large sample for generating estimates. The historical sample also allowed me to compare how player aging may have changed over the several decades. In order to see how players improve and decline with age, it's necessary to use players with sufficiently long careers to quantify age changes. I included players who played at least ten seasons with a minimum of 5,000 career plate appearances for hitters, and 4,000 career batters faced for pitcher. Each season, a player must have at least 300 plate appearances, and 200 batters faced for pitchers. Furthermore, because when players begin and end their careers is not random-good players tend to start earlier and end later than inferior players-I only looked at player performances from the ages of 24 to 35, even though careers extend beyond this range. A potential problem with the sample is that the restrictions that allow players to be tracked over a long period of time mean that I am using a cohort of good baseball players. If good players age differently from bad players, then the results might not be applicable beyond this group. However, as I detail below, aging does not appear to be correlated with performance and the results do not change when I lessen the restrictions for inclusion in the study. The Estimation Method I used a multiple regression technique specifically designed to address common problems that arise when estimating relationships across many different units over time. Multiple regression analysis allows me to estimate the impact of individual factors while holding other potential contributing factors constant. For example, the performance of a player will be affected not just by his age, but by his natural ability. By including a player's average career performance in the estimation model, I was able to hold this factor constant, so that changes in age and natural ability could be determined independently. In addition, it's important to adjust for the changing playing environments in which players play. I controlled for the influence of home parks by adjusting each players performance using park effects. Accounting for changes across eras is a bit more difficult; for example, a hitter who began his career in the late-1980s, when offense was low, and played into the early-2000s, when it was high, may appear not to have aged much at all with raw statistics. Therefore, I converted each player's performance into a z-score, measuring how many standard deviations a player's performances is from the league average that year. This way, as the run environment changes over a player's career, his performance will be measured relatively against his peers so as to reveal changes from aging. The Results I used the data to look at several different aspects of player performance from the general to the specific. Overall, I found that both hitters and pitchers peaked around age 29. However, some skills peaked earlier and others peaked later. Peak Age by Skill Hitters Pitchers Metric Peak Age Metric Peak Age Linear Weights 29.4 ERA 29.2 OBP 30.0 Strikeout Rate 23.6 SLG 28.6 Walk Rate 32.5 AVG 28.4 Home Run Rate 27.4 Walk Rate 32.3 2B+3B Rate 28.3 Home Run Rate 29.9 The table reveals that player skills peak at different times, often quite far apart from each other. Hitters peak in batting and slugging average at 28 while continuing to improve in their home-run hitting and walking abilities until 30 and 32, respectively. Home runs rising beyond the peak for doubles and triples indicates that foot-speed on the basepaths fades before hitting power. In addition, batters may be using veteran knowledge to better manage the strike-zone-or possibly becoming more friendly with umpires-to walk more and hit with power as they age. Pitcher strikeout ability peaks around 24, while walk prevention peaks nine years later. Again, veteran know-how appears to be playing a role in improving performance to compensate for diminishing physical skills. This is consistent with something that exercise physiologists have documented among golfers who hit more fairways as driving distance begins to fade. It's also been observed that athletic feats that involve quick bursts of speed and strength peak earlier than skills that rely on more endurance and knowledge. The length of the historical sample also allowed me to observe how peak performance has changed over time. The graph below maps the peak ages for hitters and pitchers by decade of birth:
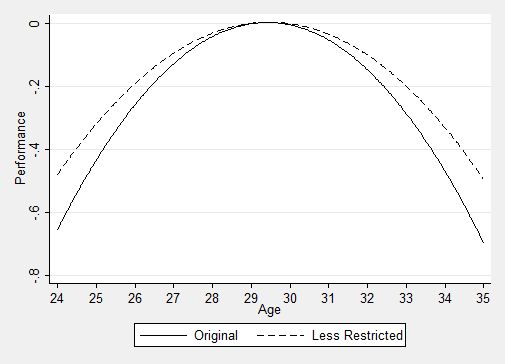
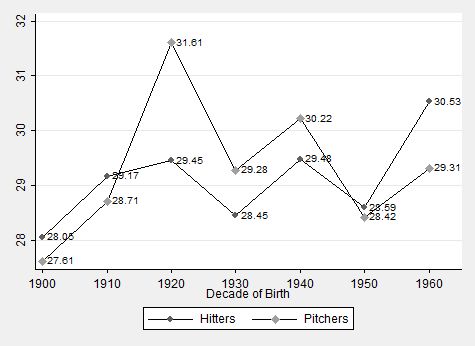 For hitters, the lowest and highest peaks occur among the oldest and newest cohorts, and there is a slight upward trend in peak age; however, the trend is not continuously increasing. For pitchers, there is no trend in peak ages. Overall, there is some evidence that peak ages may have risen for hitters, but it's not clear that the higher peak age in the present is different from random fluctuation. While it might be surprising that the dramatic improvements in wealth and health over the past century have not increased baseball players' peaks, this is actually consistent with evidence from other sports. World records consistently fall in sports, but the age at which records are typically recorded has remained constant. While athletes are improving relative to the past, they continue to reach their highest potential at the same age. Revisiting Sample Choice The most frequent critique of my study has been that the results are derived from a sample of good players. That is certainly a possibility, but the way in which the regression technique estimates the aging function means that the estimates should not be affected much by the restricted sample. Whether good players decline early in their 20s or in their mid-30s, the regression will identify this. For example, look at the wide disparity in peaks between strikeout and walk abilities for pitchers. Because a long playing career is required to be included in the sample doesn't mean that we cannot investigate the correlation between playing ability and aging. If playing ability is positively correlated with aging then elite players should age differently than good players, just as good players will age better than bad one. I compared how Hall of Fame players aged relative to the entire sample, but I found very little difference. If anything, Hall of Fame players peaks a little earlier than other players. Another source of information is to examine how player ability correlates with another product of aging, longevity. A recent study by sociologists Jarron Saint Onge, Richard Rogers, and Patrick Krueger found that though major-league baseball players have life-expectancies five years higher than the average American male, better players don't live longer than inferior players. As a final test, I estimated the model using a larger sample of hitters who only had 1,000 career plate appearances. This had very little effect on the estimated aging function. The diagram below maps the aging functions for the original and less-restrictive samples, with the improving and declining performance measured in standard deviations below the peak. The estimated peak ages in both samples are virtually identical, and the rises and declines are similar. Thus, it appears that the sample restrictions are not biasing the estimates of peak age upwards.
 Conclusion I began my investigation into how baseball players age in order to address some potential problems with past studies. It turns out that after correcting for those flaws that the peak age of baseball players appears to be around 29, and possibly 30 for hitters in modern times. Of course, some players will peak earlier and others later, but this is a general benchmark. I find it interesting that despite his unwavering pronouncement of when players peaked when the article opened, James's tone was tempered in his general conclusion: Good hitters stay around, weak hitters don't. Most players are declining by age 30; all players are declining by age 33. There are difference in rates of decline, but those differences are far less significant for the assessment of future value than are the differing levels of ability (James, 1982, p. 205). And that's probably about as technical as we need to get. --- J.C. Bradbury is an economist and associate professor at Kennesaw State University. He runs the website Sabernomics.com and is the author of The Baseball Economist. He can be reached here.
|
 )
)
I found it interesting that you had specific skills split up by their peaks, therefore using them as the building blocks to the entirety of a player's value at certain ages. I'm interested in the walk rates being so much older than the other skills, but not surprised that it's the case, as the older a player gets, the better understanding of the strike zone they possess.
I guess my main question from this research is determining the value in regards to an extended period of time as to where a player is at his most valuable as opposed to just his peak. If the general benchmark is 29, then is the range of top performance in the 27-31 range? 26-32?
"...as the older a player gets, the better understanding of the strike zone they possess."
It could be that or could it be the longer the player is in the game the more leeway he gets from the umpires on close pitches?
That could contribute, but it feels like any effects from that would be minimal. I don't have the source handy, but I remember some studies on the interweb that showed that certain players with "he gets the benefit of the doubt" reputations really didn't get more calls.
With how far away from the other skills this is, I'd think it has to be something more significant than umpire favoritism. Such as skill improvement.
Generally good players gain the opportunity to take more walks as they get older - the assumption is that a pitcher's ball/strike ratio will increase as he gains more "respect" for the batter.
Some players choose to take the walks (Sammy Sosa). Others (Garret Anderson) choose not to.
Or, the player recognizes he can't catch up to certain pitches anymore, so he doesn't swing at them. When a player in his 30's has an OBP spike, it's usually not Good News.