 7 comments have been left for this article.
 BP Comment Quick Links

|

|
October 11, 2009 Ahead in the CountRanking the Ds
Although early sabermetrics treated defense somewhat dismissively, better metrics for estimating defensive performance have emerged over the last few years. One of the oldest metrics is Defensive Efficiency (DE), created by Bill James, and this was improved by James Click in 2003 when he created Park-Adjusted Defensive Efficiency (PADE). This metric does a good job at evaluating team defense, and other metrics such as BP's FRAA, John Dewan's Plus/Minus system with Fielding Runs Saved (FRS), and Mitchel Lichtman's Ultimate Zone Rating (UZR) became available to evaluate individual player defense. However, I've begun to look at DE and PADE, and I discovered a rather peculiar observation. There was a negative correlation between team Defensive Efficiency in 2008 in 2009, and it was not a trivial one-it was -0.29. I checked whether this was typical of DE, and apparently it is not. There has been a positive correlation between DE and the previous year's DE in every pair of years in the Retrosheet era (1954-2009). Adjusting for park, PADE shows a negative correlation as well, of -0.10. This number has only been negative once during the Retrosheet era, between 1979 and 1980. Consider the following graph of the correlation between a team's DE and its DE the previous year.
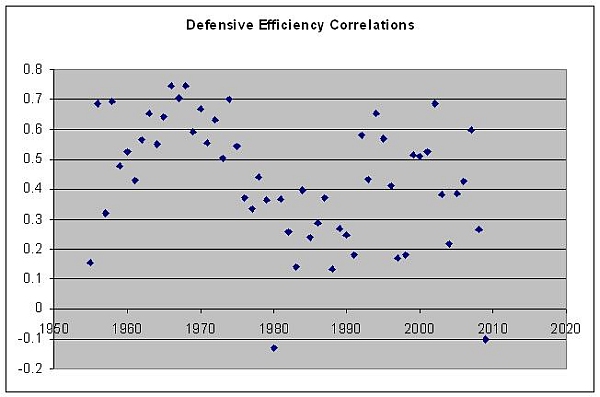 There clearly seems to be something anomalous about this year. Despite averaging a correlation of 0.43 during the Retrosheet era, there was suddenly a negative correlation in Defensive Efficiency for only the second time. The one thing that we know about 1979-80 is that this pair of seasons were among the first after free agency began; perhaps many players shifted teams during this offseason. Those two seasons certainly had a lower correlation for DE, which now showed only a 0.34 year-to-year correlation from 1976-2009. One thing that I wondered was whether certain teams had recently identified defense as an undervalued asset, and had been targeting or shedding players, leading many especially strong defenders and many especially weak defenders to change teams. The Mariners are a team that has made a conscious effort to improve the quality of their outfield defense. I began to wonder if this was what was going on. After the release of Moneyball, many teams began targeting players with high OBP; I was curious if there was a similar pattern with OBP during that era:
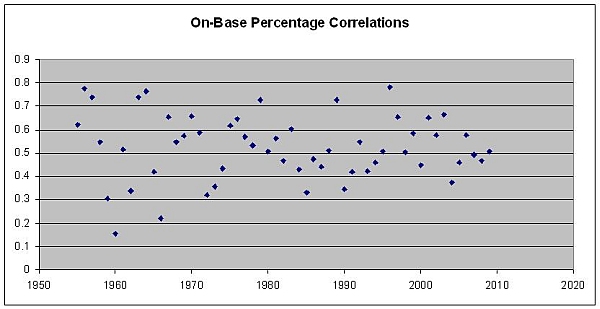 It looks like 2003-2004 was a lower point for OBP correlation, but not as distinctly, as DE showed in 2008-2009. I decided to look through which teams had the largest changes in PADE to find a clue as to what was causing this phenomenon. Here is the list of teams, sorted by PADE in 2009: Year Team DE PADE Year Team DE PADE 2009 Giants .706 2.72 2008 Cubs .705 2.46 2009 Dodgers .714 2.54 2008 Red Sox .699 2.25 2009 Mariners .713 2.47 2008 Rays .710 1.26 2009 Cubs .702 2.29 2008 Marlins .693 0.96 2009 Rangers .700 1.08 2008 Astros .698 0.81 2009 Rockies .690 0.70 2008 Phillies .696 0.58 2009 Reds .704 0.59 2008 Blue Jays .704 0.45 2009 Phillies .695 0.39 2008 Braves .694 0.39 2009 Marlins .684 0.09 2008 Indians .686 0.13 2009 Cardinals .697 0.02 2008 Brewers .698 0.04 2009 Tigers .695 -0.05 2008 Angels .692 -0.09 2009 Yankees .698 -0.22 2008 Royals .690 -0.19 2009 Indians .681 -0.37 2008 Giants .685 -0.25 2009 Rays .696 -0.52 2008 Mets .698 -0.34 2009 White Sox .689 -0.62 2008 Athletics .700 -0.35 2009 Angels .689 -0.84 2008 Dodgers .691 -0.49 2009 D'backs .686 -0.95 2008 Padres .696 -0.52 2009 Red Sox .679 -1.11 2008 Tigers .685 -0.53 2009 Braves .687 -1.16 2008 Cardinals .695 -0.54 2009 Twins .692 -1.25 2008 Orioles .688 -0.72 2009 Pirates .691 -1.40 2008 D'backs .686 -0.76 2009 Orioles .680 -1.41 2008 White Sox .686 -1.14 2009 Brewers .689 -1.42 2008 Rockies .678 -1.24 2009 Padres .694 -1.75 2008 Nationals .689 -1.36 2009 Royals .675 -1.81 2008 Yankees .682 -2.42 2009 Mets .692 -1.92 2008 Mariners .682 -2.44 2009 Astros .677 -2.33 2008 Twins .687 -2.51 2009 Nationals .685 -2.37 2008 Pirates .675 -3.17 2009 Athletics .684 -2.77 2008 Rangers .670 -3.40 2009 Blue Jays .683 -2.89 2008 Reds .673 -3.83 It does not appear that any outliers are causing the negative correlation; to the contrary, nine of the top 15 teams in Defensive Efficiency in 2009 were in the bottom 15 teams in DE in 2008. This seems to be a new trend. Seeing this, I decided to go through the teams who saw the largest changes in PADE to discover what personnel changes they had, and what changes in UZR, FRS, and FRAA these players saw. I used these three separate individual defensive metrics because all defensive metrics are still pretty noisy, and one might have picked up what another did not. Atlanta: The Braves went from +0.39 PADE to -1.16 in just one year, and went from a DE of .694 to .687. They experienced several personnel changes. Mark Teixeira departed for the big city and left a mixture of Casey Kotchman and Adam LaRoche to play defense at first base; according to UZR, this probably only cost them three or four runs, but according to FRS and FRAA, it cost them about 15 runs. Replacing a left-field job-share centered around Gregor Blanco with veteran Garret Anderson cost them a number of runs this year as well, about 13 according to UZR, about six according to FRS, and was about neutral according to FRAA. Atlanta's primary center fielders in 2008 were Mark Kotsay and Josh Anderson; in 2009, the most common center fielders were Nate McLouth and Jordan Schaefer. All three systems appear to see this as mostly a neutral change. Jeff Francoeur was the right fielder for all of 2008 and some of 2009, but Ryan Church replaced him last year; there appears to be have been a slightly positive gain, partly due to an improvement in Francoeur, and partly due to Church's defensive play. One of the largest impacts on Atlanta's defense appears to have been Chipper Jones' decline. We all know about his slide at the plate this season, but few have made as large a fuss out of his defensive decline. However, his UZR fell from 5.1 to -8.9, his FRS fell from 10 to -6, and his FRAA fell from 7 to -14. As a result, we can assert that his defensive decline cost the team somewhere between 14-21 runs. Boston: The Red Sox plummeted from among the league's best in PADE at 2.25 down to one of the worst at -1.11. This came as a result of a few small changes. Shortstop was split among several players in 2008 for Boston, including Julio Lugo, Alex Cora, and Jed Lowrie. That had cost the team about four or five runs according to UZR and FRS, and saved the team about fifteen runs according to FRAA; the effect of this defensive shift has been ambiguous according to the numbers. Left-field was split between Manny Ramirez, Jacoby Ellsbury, and later, Jason Bay in 2008, but Bay spent all of 2009 beneath the Green Monster. Bay looks particularly bad according to UZR, about eight runs below average in 2008, and -12.3 in 2009. As Ellsbury's left-field play was particularly strong (9.3 UZR) and Manny's was decent (1.5 UZR), it appears that Bay's defense in left has cost the Red Sox mightily. According to FRS, Bay was poor in 2008 but better in 2009; he was listed as average in 2009, meaning that the Red Sox saw an improvement in left according to FRS. Finally, FRAA also saw the change as an improvement, scoring Bay's 2009 campaign worth 15 FRAA. Center field was split between Coco Crisp and Ellsbury in 2008, but Ellsbury held it down for all of 2009. This cost the team ten runs according to UZR, as Ellsbury had a -15.6 UZR. It cost them ten runs according to FRS as well, and it cost them 19 runs according to FRAA, due to Ellsbury's -17. Cincinnati: No team had a lower PADE in 2008 than the Reds, but by 2009, they were seventh in the majors, going from -3.83 to 0.59. They also went from sporting a Defensive Efficiency of .673 to this year's .704. The reason why is less clear. They changed catchers, going from Paul Bako getting the majority of innings behind the plate to Ryan Hannigan and Ramon Hernandez that playing time. Defensive statistics are not particularly strong for catchers, but chances are that they would not affect the rate of recording outs on balls in play anyway. One change that had a large effect was the change in shortstops-during 2008, Jeff Keppinger and Jerry Hairston Jr. got the majority of playing time, and during 2009, shortstop was mostly divided between Alex Gonzalez and Paul Janish. The 2008 shortstop pair had UZR of -13.8 and -2.3; the 2009 duo outperformed them handily at 10.7 and 2.4, a net difference of 29.2 runs. FRS credits the new duo with a 20-run improvement over the old duo, and FRAA acknowledges a 25-run difference. This agreement across three different systems shows a clear improvement at shortstop that must have been a large part of their improvement afield. At third base, Encarnacion got the majority of innings in 2008, but with his 2009 struggles, he shared the position with Adam Rosales and was later replaced by Scott Rolen. FRAA credits this as a seven-run improvement, while UZR sees this as a 4.8-run drop. FRS does not split up numbers for players who played on multiple teams, but Encarnacion had a FRS of -17 runs in 2008, but Rosales had a -2 FRS, Encarnacion's season total was -8 FRS, and Rolen's season total was +15. It seems pretty clear that all three systems see an improvement at both positions on the left side of the infield. Out in left field, shedding Adam Dunn helped the Reds as well. In 2009, Nix, Dickerson, and Gomes split time, and all three had roughly average defensive numbers depending on the system, while Dunn was about 10-20 runs below average in 2008, depending on which metric you use. In right field, the Reds saw Jay Bruce go from splitting time with Ken Griffey Jr. to splitting it with Jonny Gomes; UZR saw this as about an 18-run improvement, as did FRS, and FRAA saw it as a 10-run improvement. Colorado: The Rockies went from a PADE of -1.24 to +0.70 in the past year, and did so without changing their catcher or their infield. However, the Rockies' outfield changed a lot. Matt Holliday was traded away and Seth Smith took over most of the playing time in left, but UZR, FRAA, and FRS all agree that this was a neutral move between two above-average defenders. Willy Taveras recorded good defensive numbers as a Red in 2009, but recorded mediocre ones when he was a Rockie in 2008; in his stead, Dexter Fowler and Carlos Gonzalez got a lot of playing time, but their numbers were below average. According to UZR, this drop lowered them from -2.2 to -14.3 runs, FRS saw this as a drop from 0 to -10 runs, and FRAA saw this as an improvement from -5 to 5 runs. Brad Hawpe remained in right field, but his numbers went from beyond terrible to a more normal grade of miserable in 2009 according to all three of these metrics: his UZR went up from -37.2 to -19.8, his FRAA went up from -45 to -14, and his FRS went from -22 to -9. So, he's still bad, but much better. It seems surprising that an improvement from worst to among the worst would make such a big difference, so chances are that a large portion of this improvement is just regression to the mean after an unlucky defensive season for the Rockies in 2008. Houston: The Astros' defense fell apart in 2009, although the reason is not clear. They went from a PADE of +0.81 to -2.33. They switched catchers from Brad Ausmus to Ivan Rodriguez, but this is unlikely to change the rate of recording outs on balls in play. The metrics do show regressions by Lance Berkman at first base and Miguel Tejada at shortstop, however. Berkman supposedly lost somewhere between 10 and 13 runs in his performance, and Tejada somehow lost 22 runs according to UZR, 18 according to FRAA, and 17 according to FRS. This could just be the product of an old team, but no other players showed massive losses in their defensive metrics. Los Angeles Dodgers: The Dodgers' PADE shot up from -0.49 to +2.54. Jeff Kent's retirement gave way to Orlando Hudson, who performed slightly better on defense, adding somewhere between three runs according to FRAA to 15 runs according to FRS. At shortstop, Furcal missed much of 2008, but getting him back gave the Dodgers back somewhere between six and 16.3 runs. Although the distribution of playing time between Manny Ramirez and Juan Pierre changed a little bit, the defensive metrics did not show much of a change in their cumulative performance. New York Yankees: The Yankees went from among the worst teams in defense with a PADE of -2.42 in 2008 back to the middle of the pack at -0.22. The only changes came at first base and right field. At first, Mark Teixeira replaced Jason Giambi, which added 5.5 runs by UZR, 12 runs via FRS, and 20 runs according to FRAA. In right field, Bobby Abreu's rapidly declining defense gave way to Nick Swisher's. According to FRS and FRAA, this added 13 runs, but according to UZR, Abreu's -25.6 runs was replaced with just +3.0 runs from Swisher. These two changes may have had some effect, but chances are the Yankees' improvement probably was due to regression to the mean. Oakland: The A's let Jason Giambi play first base for a bit before giving the rest of the playing time to Daric Barton again, and predictably, Giambi's time at first cost them a few runs. Bobby Crosby wasn't a regular at short in 2009 after playing most of 2008, with Orlando Cabrera playing most of the time there in his stead; Cabrera's defense rated far worse, costing the team about 11.9 runs according to UZR, giving them back 13 runs according to FRAA, but costing them about 20 runs according to FRS. At third, Jack Hannahan played the majority of the 2008 season, but Adam Kennedy got that time in 2009. This cost the A's about 4.8 runs according to UZR, about 10 runs according to FRAA, and about 12 runs according to FRS. Replacing Jack Cust with Matt Holliday for some of the year helped their defense in left field, and Rajai Davis went from splitting time in center with Carlos Gonzalez to splitting it with Ryan Sweeney, but this seemingly had negligible effects on defense overall. These minor changes don't appear to account for such a huge gap in defense. However, the picture becomes clearer when looking at second baseman, via Mark Ellis' declining numbers: his UZR went from 17.4 to 2.1, his FRS went from 24 to 0, and his FRAA went from 5 to 9. Seattle: The Mariners shot up from 26th to third in PADE this year, going from -2.44 to +2.47. They had made a concerted effort to change their defense this winter, making changes across the board. The Richie Sexson era had already ended, and ushered in a change to Russell Branyan at first base, which added about 6 to 10 runs depending on the metric used. Yuniesky Betancourt played a terrible shortstop in 2008, and continued to do so in 2009; his UZR put him at -12.7 in 2008 and -8.6 in 2009, while attributing a total of 7.1 runs to Ronny Cedeno and Josh Wilson, and finally Jack Wilson. Betancourt's FRS was -13 in 2008, and his combined FRS was -20 in 2009 if you include his time with the Royals, while Jack Wilson was credited with 27 FRS this year across his time with the Pirates and Mariners, so that certainly could have been a factor. FRAA did not demonstrate much of a change from this, due its more neutral evaluation of Betancourt, but it still saw an eight-run improvement for the M's. Where Seattle really spruced up its defense was in the outfield. In left, Raul Iba�ez struggled mightily afield in 2008, and he was replaced by a mixture of Endy Chavez, Michael Saunders, Wladimir Balentien, Ryan Langerhans, and Bill Hall; FRS saw this as about a 15-run improvement, FRAA saw this totaling up to a 35-run improvement, and UZR saw this as a 34.2-run improvement, so regardless of the system, the left fielders that Seattle sent out were fabulous for them in the field in 2009. The real change came in center field, though. Ichiro Suzuki and Jeremy Reed had split time there in 2008, providing a combined UZR of 7.3, while FRS and FRAA graded this out to 0. This wasn't terrible, but new center fielder's Franklin Guttierez's season was brilliant, as he had a UZR of 27.1, a FRS of 31, and a FRAA of 15. Regardless of the system, Guttierez's defense certainly appears to be a primary reason for the massive resurgence in Seattle's defense. San Francisco: The Giants went from -0.25 to +2.72 in PADE. This also came as a result of improved outfield defense, but it is not clear what changed. They saw an improvement in slugging on balls in play. Randy Winn put up solid and similar numbers in 2008 in left according to UZR and FRS, and FRAA even saw him falling from a world-beating 35 to a still-strong but weaker 13 in 2009. Aaron Rowand saw a drop in FRAA as well, falling from 19 to -4. They did make changes in their infield, though, as Travis Ishikawa replaced John Bowker at first, which led to about a 10-run improvement. Ray Durham gave way to Emmanuel Burriss, Juan Uribe, and later Freddy Sanchez at second base, which added a few runs, and Omar Vizquel surrendered shortstop to Edgar Renteria, which led to a decrease of a few runs in defense. Pablo Sandoval replaced Jose Castillo at third base, without much difference in defense as well. Looking through these changes, it is very difficult to tell what made San Francisco improve so much. Perhaps they positioned their fielders better, or perhaps they were lucky. As more data is continuously available, there probably are teams that are taking advantage of this and positioning players better, but San Francisco is not necessarily one of these teams. Texas: Texas went from a PADE of -3.40 to +1.08 over the last year. Their primary change came from shifting Michael Young to third base, replacing Ramon Vazquez, and handing shortstop over to Elvis Andrus. Although reviews were mixed about Michael Young's third-base defense, his shortstop defense rated poorly according to all three metrics, while Andrus' rated very well. UZR saw this shortstop change as a 15.9-run improvement, FRS saw it as a 19-run improvement, and FRAA saw it as a five-run improvement. The Rangers also switched up their left-field mix, letting David Murphy take over from Frank Catalanotto and Brandon Boggs; this probably added about five runs, depending on the metric used. In right field, Nelson Cruz emerged in 2009 after splitting 2008 with David Murphy, Milton Bradley, Josh Hamilton, and Marlon Byrd; depending on the metric used, this may have had a positive, negative, or neutral effect, with the most positive effect suggested by FRAA of eight runs. Toronto: After being among the better half of teams in 2008 at 0.45 PADE, Toronto fell near the back of the pack at -2.89 in 2009. Joe Inglett was replaced by Aaron Hill at second base, which was a neutral move according to UZR and FRAA, but represented an 18-run improvement according to FRS. Scott Rolen was replaced by Edwin Encarnacion midway through 2009, although this had ambiguous effects on overall defense. The largest change came from a disastrous dropoff from Alex Rios, in all likelihood; although FRAA saw his 2009 as an 18-run improvement, UZR saw it as a 17.3-run decline, and FRS saw it as a decline of approximately 12 runs. It is not particularly clear what happened to Toronto either, but something appears to be either changing for the worse in Toronto or simply could be just terrible luck. Looking through these dozen teams, we can see a lot of changes going on. Some of the changes are probably due to luck and/or normal variance, but many may be structural changes. There does seem to be an overarching trend to strengthen outfield defense, which might help go some ways towards explaining the weak market for Bobby Abreu, Pat Burrell, and Adam Dunn in the last offseason. However, some teams may be improving their positioning to increase their rates of recording outs overall. John Dewan wrote a fascinating article before the 2009 season about the impressive approach that Chase Utley has to his positioning at second base. It may be that teams are making these same changes on a broader scale, and that could be part of the reason why defense showed so little correlation in the past year. We may not be able to tell the cause yet, but keep an eye on team Defensive Efficiency in 2010, and you may see whether teams continue to shuffle around randomly, shuffle back towards where they were, or whether a lot of the new elite defensive teams remain dominant for longer.
Matt Swartz is an author of Baseball Prospectus.
|
I like the article Matt.. though I'm kind of wondering how the Cubs did so well in PADE. Besides maybe Derrek Lee, do the Cubs really have an above average defender?
Also, regarding Colorado, Hawpe had some kind of leg injury for the latter part of 2008 and that might've affected his defensive performance that year more than a regression-to-the-mean.