 12 comments have been left for this article.
 BP Comment Quick Links

|

|
September 10, 2009 Solving the Rookie DilemmaPart One
Willie Mays famously started his career 0-for-12 before hitting a home run off of Warren Spahn. This season, Orioles �ber-stud catcher Matt Wieters has struggled to live up to expectations, posting a feeble .264/.310/.368 line since being called up in May. Talented rookies such as these present a twofold challenge to their teams: first, how to identify when they're ready for promotion, and second, how to react when they fail to produce. These decisions can be driven by subjective considerations, such as a scout or manager's evaluation of the player's poise and confidence. Such things are certainly important, but it's worth investigating what a purely objective mechanism for making these decisions might look like. So, today we'll try to answer the first question: How do you decide when a prospect's ready? Let's consider the common scenario in which a rookie player is competing with a veteran for the vet's job. The veteran's productivity is typically well established, while the rookie's productivity is not known as precisely. Thus, we're faced with a choice between a so-called sure thing, and an unknown but possibly superior alternative. In the field of statistical decision theory, such choices are known as "multi-armed bandit" problems. They are so named because of an analogy to a slot machine with multiple levers, each of which has a different payoff rate. The case we're examining can be modeled as the relatively simple case of a machine with two levers, one of which has a known payoff rate. In order to construct the model, we'll need two values: the veteran's productivity (the payoff rate of the known "arm") and a probability distribution on the rookie's productivity (the payoff rate of the unknown "arm"). To measure productivity, we'll use on-base percentage. Obviously, OBP is not a perfect measure of productivity; it does not consider defense, power, or baserunning skill. As a measure of offensive performance, though, it is pretty good, correlating with run-scoring to the tune of .91 (per some 2006 research by Dan Fox). Furthermore, the fact that it measures a binary outcome-either a player reaches base, or he doesn't-is extremely convenient for modeling purposes, as we'll see shortly. Since the veteran's productivity is well established, we'll quantify it as his aggregate OBP over the previous three seasons. We'll assign the rookie an OBP distribution (a beta, for my fellow stats geeks out there) based on PECOTA's projections. Now we must compare two expected values: that of starting the veteran all season and that of provisionally starting the rookie. I say "provisionally" because the team always has the option of substituting the veteran if the rookie doesn't perform well. Assuming 600 PA in a season, we can compute the expected performance of the veteran by multiplying his aggregate OBP by 600; this will give us the number of successes (i.e., non-outs) that he should contribute. Computing the expected value of provisionally starting the rookie is much more complicated, since his performance is variable and a substitution can occur at any time. I wrote an algorithm that accomplishes this by starting with the final plate appearance and iterating backward, considering all possible outcomes (in terms of successes and failures; this is why OBP is a convenient number). At each juncture, the algorithm chooses whether or not to replace the rookie based on which player offers a higher total expected value. Given the OBP of the veteran and the mean projected OBP of the rookie, the algorithm will determine whether or not the rookie should be given a shot. As it turns out, the algorithm recommends starting all but the very worst rookies who have very good replacements. Six-hundred PA is a lot of playing time, so the cost of possible early failures by the rookie is small relative to the long-term gain to be had if the rookie turns out to be highly productive. To get a better idea of how profitable starting the rookie can be, we can ask how good his veteran replacement would need to be in order for playing the veteran to yield the same expected value as giving the rookie a shot. If the veteran's OBP is greater than this "break-even" value, then the rookie should not start; if it is less, then the kid definitely should be in the lineup. This has all been rather abstract, so let's examine some specific cases from this year to see the algorithm in action. The rookies we'll look at are Wieters and someone who is perhaps a more typical prospect, Marlins center fielder Cameron Maybin. Below are their pre-season PECOTA projected OBP percentiles, along with the OBP of their initial likely veteran replacements and the "break-even" OBP produced by the algorithm:
                                        Vet's                 Break-even
Rookie    Mean   90th  10th   Veteran    OBP (2006/2007/2008)   OBP
Wieters   .392   .432  .356   Zaun      .348 (.363/.341/.340)  .415
Maybin    .345   .388  .311   Amezaga   .323 (.332/.324/.312)  .370
This information is perhaps better presented visually. In the following diagrams, the rookie's mean projected OBP is in blue, the veteran's aggregate OBP is in red, and the break-even OBP is in green:
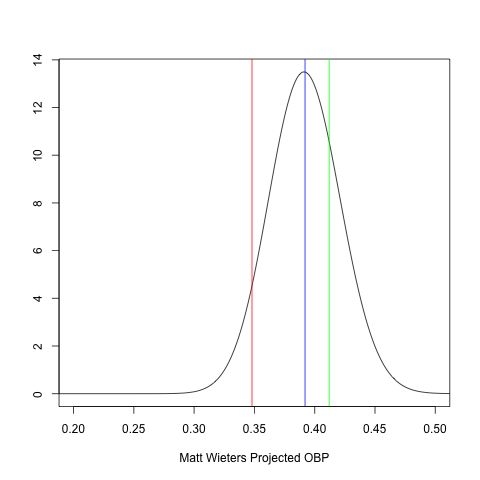
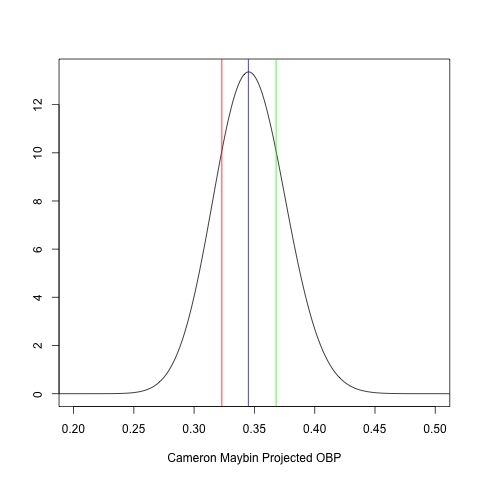 We can see that, based on expected OBP alone, both rookies should have started over their veteran counterparts, and it's not even close. The Orioles would have needed a catcher who could be expected to post a .415 OBP in order to justify keeping Wieters in the minors; Zaun is adequate at the plate, but he's nowhere near that level. Likewise, Amezaga's aggregate OBP is well below the .370 needed to deny Maybin a shot. In point of fact, Maybin was the Marlins' Opening Day center fielder, while Wieters was kept in the minors until the end of May; the latter decision was almost certainly motivated by service-time concerns, however. This analysis is rather involved; fortunately, there appears to be a trend that leads to a simple rule of thumb. Notice that these break-even values are roughly .020 higher than the rookie's mean projected OBP. I performed this analysis with several other rookies, and found this to be the case generally. Thus, it appears that a rookie should start unless a veteran can be expected to post an OBP at least .020 higher than the rookie's mean projection. Of course, this rule is not meant to be definitive. The analysis on which it is based considers only OBP, ignoring power, defense, and other relevant factors; in addition, the assumption that the veteran's OBP is fixed, though reasonable, is clearly false. Rather, the rule should be seen as a starting point to be supplemented with other information. It also serves to highlight just how much a team stands to gain by giving a promising rookie a chance. Even if there's only a small chance that a rookie will be more productive than an established player, it is usually worth investing a few games of baseball's long season to find out if this is the case. After all, the rookie can always be benched or sent down to the minors if the experiment doesn't work out. In the next part of this diptych, I'll attempt to determine just how badly the rookie needs to perform in order to justify such a decision. Dan Malkiel is an intern for Baseball Prospectus.
Dan Malkiel is an author of Baseball Prospectus.
|
If you do the disparity between Bengie Molina and Buster Posey's projected OBP, will I need a widescreen monitor to view the graph?