 11 comments have been left for this article.
 BP Comment Quick Links

|

|
September 2, 2009 Checking the NumbersOff the LidgeBrad Lidge's tenure with the Phillies has been about as topsy-turvy as is possible in baseball, with an initial excellence that made fans feel safe as the final frame rolled around followed by a sophomore-effort putridity that's making fans who previously partook in Halo Effect activities wish former GM Pat Gillick never offered Lidge that three-year contract extension. After blowing nary a save last year, many were convinced that the Lidge of old-the dominant reliever who helped make Billy Wagner expendable to the Astros in 2003 and repeated the act with Octavio Dotel the very next season-had returned. Unfortunately, the so-called return to form was short-lived, as Lidge's 2009 campaign has been marred by injury and ineffectiveness, with a -1.93 WXRL mark that registers as the worst in baseball; as of Tuesday, Kyle Farnsworth ranked second worst with a -1.29. With a 7.03 ERA, 1.73 WHIP, and 62.9 percent strand rate as symptoms of system-wide failure, perhaps we need to step back and ask, what the heck has gone wrong here? How can someone go from being the best reliever in the game one year-Lidge's 7.61 WXRL led all relievers last season, and ranks among the 20 best relief seasons on record during the Retrosheet era-to the very worst a year later? Standard Seidman protocol when researching the improvement or decline of a player involves probing the data from a wide array of performance facets in an attempt to answer several underlying questions. Is Lidge throwing slower? Has his movement deteriorated? Is his pitch distribution different? Are hitters still chasing pitches out of the zone? How do they fare on pitches within the strike zone? Can some or all be explained by fluky, regression-bound metrics? For hitters, another avenue of exploration incorporates splits into the mix, but split data is generally comprised of small samples for pitchers and relievers accrue an even smaller sample of playing time. Plus, as I have discussed before in this space, qualitative information may be more valuable with regards to certain splits. In the cage match of Brad Lidge vs. days' rest, which has sprung up as a potential cause for his troubles, common sense dictates that very, very few closers should be used three or four days in a row, whether that agrees or disagrees with his specific data. Lidge throws two pitches: a four-seam fastball in the mid-90s, and a devastating slider that breaks sharply just before crossing the plate. The diagrams below show the flight patterns of his pitches from the first baseman's point of view. Generally, such diagrams compare different pitches as a means of accentuating the break or lack thereof on specific pitches, but instead I chose to diagram the year-by-year comparison for each pitch in order to get an idea of how the pitches have changed.
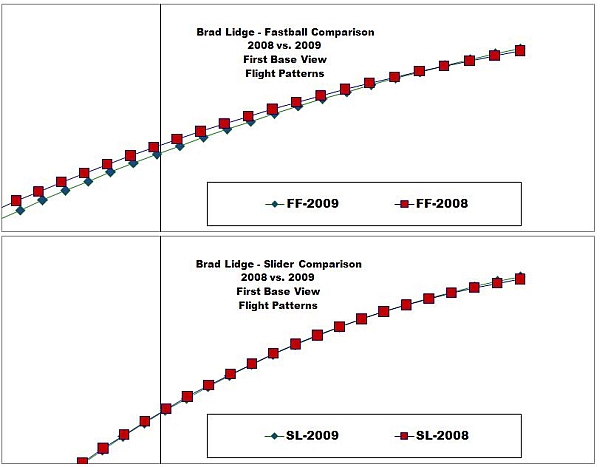 The pitches work in tandem, and since they comprise the only two weapons in his arsenal it stands to reason that, as one goes, so too does the other. As the flight patterns suggest, Lidge's slider has been moving in identical fashion to a year ago, evidenced by the fact that one year literally smothers the other. The fastball, however, has been moving differently, even if the discrepancy between the two is subtle. According to the linear-weight pitch results on a per-100-pitch basis, Lidge's heater was -0.53 runs/100 last season, while the slider proved to be one of the best pitches in the game at 2.50 runs/100. Essentially, his fastball didn't necessarily hurt him much, and it enhanced the effectiveness of the slider. This season, the data has not been replicated and seems to be moving very much in the opposite direction: Lidge's current fastball is worth -2.96 runs/100, which is one of the worst marks in the game, and as a result it has hindered his ability to get optimal results with his slider, as it's currently clocking in right around average at -0.11 runs/100. The heat maps below show the rather drastic differences in fastball productivity of pitches delivered in and around the strike zone, documenting how someone could go from -0.53 to -2.96 runs/100 in the matter of one season:
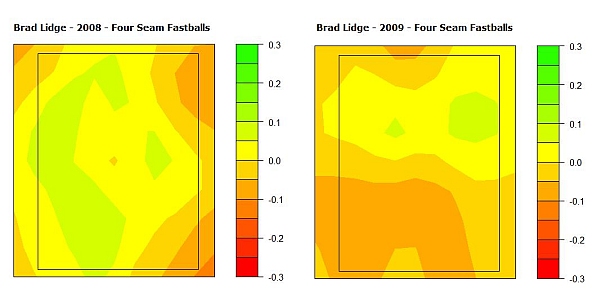 Here we see that Lidge's 2008 fastball rarely dipped into the reddish hue, hovering right around the average mark for much of the strike zone with a fair share of the positive green tossed in. This year, a much greater percentage of the heat map is made up of the below average colors. Why has the fastball dropped off so substantially? For starters, the fastball happens to be a tick slower than its average velocity a year ago, and way down from the average velocity he was throwing it at before joining the Phillies-back in 2007, Lidge regularly reached 96 mph, yet he managed just 94.1 mph last season, an average velocity that has dropped further to 93.4 mph this season. While a 93.4 mph fastball isn't worthy of criticism by its lonesome, it certainly doesn't reach the plate with the same force as a pitch with similar movement that is thrown two and a half miles per hour faster. In fact, a few television analysts have even set forth the idea that the difference between 94 and 97 mph is of a much greater magnitude than ranging between 88 and 91 mph, sort of akin to how the marginal wins added total of a player goes through peaks and valleys. If true, this could explain much of the issues here, as Lidge's drop of 1.9 mph from 2007-08 and another 0.7 mph since then may have turned the pitch from sneakily fast with very little time to react into a run-of-the-mill fastball that hitters are used to seeing from mediocre relievers. This would then adversely affect the slider's effectiveness, as the opposition might not be caught off guard by it as often. Compounding this year's problems is a slight loss in horizontal movement, by about a half-inch. This may or may not be significant, but in a game of inches like baseball, that half-inch could be the difference between the edge of the inside corner and the middle of the plate. Another question then arises with this data: from 2007 onward, the velocity and movement components of his fastball have each declined, but how has that translated into the plate discipline of opposing hitters? Truth be told, the results are fairly predictable, as Lidge is inducing fewer out-of-zone swings while allowing much more contact within the zone. In fact, the opposition has made contact with 83 percent of Lidge's in zone offerings this season, which is way, way up from the 58 percent rate back in his dominant 2004 season when he also averaged right around 96 mph with the heater. We can quibble at length about the differences between 96 and 94 mph and 4.56 vs. 4.05 inches of horizontal movement, but when hitters are making contact 45 percent more often, it becomes alarmingly clear that the deltas are quite telling. Add in that hitters have increased their propensity for swinging at Lidge's offerings in the zone, and it becomes apparent that they are now capable of staying on his once-dominant fastball, simultaneously spitting at the outside slider. A direct result of the shifting plate-discipline data is a drop in K/9 from 11.9 to 9.3 over the past three seasons that is exacerbated by a BB/9 rise from 4.0 to 4.6. Oh, and after a minuscule and unsustainable 0.3 HR/9 last year, Lidge has regressed to Eric Milton's mean, and is allowing a hair above two gopherballs per nine frames. One area we have yet to explore is location, and the table below breaks down both the fastball and slider in each year based on zone percentages. By corners I am referring to the outer edges of the actual strike zone for a hitter, extending a bit more out of the strike zone since umpires are not what we would call consistent. However, the zones themselves are individual to the hitters at the dish as set by the PITCHf/x operators, and not normalized to one aggregate average.Year FB-Zone FB-Corner SL-Zone SL-Corners 2008 38.1 19.7 37.6 15.1 2009 36.6 21.1 37.1 16.2 At first glance, the data presented above sort of leaves location out as being an end-all solution, since the percentages are virtually identical in both cases. One could even argue that the zone numbers this season are better than those posted last year. A caveat, however, would be that the similar locations are actually an indicator that Lidge has not yet adjusted to throwing 93 mph and not 96 mph; as in, Lidge is continuing to pitch with the approach of a pure power pitcher capable of blowing guys away and deceiving them with sliders in the dirt, when in fact he has experienced a very real dropoff in his stuff, which, while still a bit nasty, is no longer nasty enough to separate him from the rest of the reliever pool. Throwing 96-97 mph, a pitcher can get away with a mistake pitch catching too much of the plate every now and then, a luxury not afforded to those in the 92-93 mph range. The change in velocity and movement appears to have been enough to cause hitters to lay off of pitches at which they previously made feeble swing attempts, which has also caused Lidge to alter his distribution from 43 percent fastballs and 57 percent sliders to a perfectly even 50/50 split. Lidge needs to make a very real adjustment if he cannot find the lost velocity; he needs to work the corners more and use his fastball as more than a set-up pitch for the slider. His herky-jerky mechanics lead many to believe he simply has no idea where the ball will cross the plate, but this likely isn't the case, and Lidge should be able to make appropriate adjustments once it gets drilled into his head enough that the adjustments need to be made. Based on what Lidge and pitching coach Rich Dubee have publicly stated, the in-house diagnoses deal more with mechanics and not compensating for the knee tendonitis he's struggled with, which, while valid to the point that it may be the root cause behind the dropoffs in velocity and movement, ignores the fact that the dropoffs have in fact occurred. Another oft-mentioned factor may also be rearing its ugly head this year, as his fluky-low 62.9 percent strand rate, abnormally high .340 BABIP, and a HR/9 rate almost ten times what it was last season combine to suggest that Lidge has experienced some very bad luck. As Rob Neyer astutely pointed out, though, we can likely shave off at most one and a half runs from the ERA to counteract the negative luck, and 7.03-1.50 = 5.53 is still unacceptably bad for a closer who is yet to lose his role outside of time spent on the disabled list. In fact, finding relievers that managed to hold steady roles while posting a ERA above 6.50 entering the final month of the season is a challenge, let alone finding closers in similar situations. All of the pertinent data suggests that, much like getting rid of the lead vampire will turn the disciples back to normal, if Lidge can alter his approach and pitch to what he has to offer now as opposed to what he had going for him two years ago, the plate-discipline data and linear-weights pitch results should revert to something closer to his prior norms. Then again, relievers accrue such small samples of playing time. We tend to ignore that these are such small samples because the innings are spread over a longer period of time. Regardless of the timeframe, 45 innings is 45 innings, and anything can happen in such a brief period. Repeat this season 25,000 times in a simulation, and even with adjustments to projections based on what we know now, he might perform admirably half of the time. For all we know, he could avoid making the adjustment discussed above and have a 2010 season reminiscent of his 2004 dominance. Tomorrow, however, we will take a look at just how bad his 2009 campaign has been from an historical perspective.
Eric Seidman is an author of Baseball Prospectus.
|
This is brilliant, thanks.