 31 comments have been left for this article.
 BP Comment Quick Links

|

|
August 18, 2009 Ahead in the CountHome-Field Advantages, Part Two
Last week, we began our look into home-field advantage by looking at what home teams actually do better than road teams. It has been well documented throughout baseball history that the home team wins about 54 percent of ballgames, and last week we determined that the home team was better at pretty much everything. They struck out less, walked more, hit more home runs, got more hits on balls in play, made fewer errors, converted more double-play opportunities, stretched more extra-base hits into triples, hit more line drives, and they recorded more complete-game shutouts. The home team was able to take an advantage in nearly every aspect of the game. This week, we will carry that discussion of what home-field advantage helps into who it actually helps the most. On June 4, Cole Hamels shut out the Dodgers, who at that time boasted the best record in the National League. More impressively, this feat came in Dodger Stadium. As mentioned last week, even though road teams scrape out 46 percent of ballgames, they only put together 41 percent of all complete-game shutouts. What was special about Cole Hamels? Was he a hundred feet tall? Was it something about the Phillies? The first clue might have been that, at that point, the Phillies had a 20-6 record on the road, but were only a 12-14 record at home for 2009. The average difference between home winning percentage and away winning percentage is eight percent; after Hamels' shutout, the Phillies sat at -30 percent! This did not seem to surprise the Philadelphia media all that much. The Phillies only had a regular-season home-field advantage of 4.9 percent in 2008, and in the four years before that they had home-field "advantages" of 6.2, -3.7, 4.9, and -2.5 percent. It seemed that the Phillies played much worse than other teams at home relative to how they played on the road. Phillies manager Charlie Manuel had an explanation for the team's 2009 performance at the ready-the fanfare surrounding the World Series celebrations was distracting them. There had been ceremony after ceremony through the first several weeks of the season, and Manuel supposed that this was keeping his players from concentrating at home. Last year, Jimmy Rollins said that the Phillies fans had intimidated the home nine, and Rollins even went so far as to call them "frontrunners," immediately giving every cable sports show the hottest topic in the world to run with for a few days. Would the Phillies fans boo Rollins when he came back to town? Were the Phillies fans and their anti-Santa agenda too much? Others suggested that the Phillies were a fly-ball pitching staff, and that they were thus more vulnerable to Citizens Bank Park's homer-friendly dimensions. What complicated this speculation was that the Phillies two percent home-field advantage for 2004-2008 was contradicted by their 7-0 playoff record at home in their World Series run in 2008. They only went 4-3 on the road in the playoffs, meaning that their home-field advantage for the playoffs was 43 percent, more than five times the league average home-field advantage, and over twenty times their advantage over the previous five seasons. Was there something different about the playoffs? Alternatively, perhaps there was nothing special about either the Phillies in the regular season or the Phillies in the playoffs. Consider the following possibility-perhaps no team has a larger home-field advantage than any other team. That sounds impossible, right? Look at the home-field advantage over the last five years for every major league team: Team HFA% Phillies 1.98 Orioles 3.32 Tigers 3.95 Angels 3.95 Padres 4.32 Cubs 4.56 Giants 4.84 Marlins 5.31 Mets 5.43 Indians 6.68 D'backs 6.91 Royals 7.11 Cardinals 7.55 Nationals 7.99 White Sox 8.50 Athletics 8.52 Braves 9.14 Reds 9.14 Dodgers 9.88 Rangers 9.88 Pirates 10.73 Yankees 10.86 Twins 11.48 Astros 11.50 Mariners 12.16 Blue Jays 13.47 Rockies 13.94 Red Sox 14.32 Brewers 15.70 Rays 17.66 The Phillies had the smallest home-field advantage in the major leagues over that time span. There was a huge difference between the Phillies and the Rays, who had a winning percentage that was nearly 18 percentage points higher at home than on the road. However, we would not expect that every team had a home-field advantage of exactly eight percent, even if no team had any special home-field advantage; some teams would have some luck at home, or some luck on the road, and the numbers would change. So I checked the correlation between home-field advantage one year and the next for 2004-2008-the correlation was only 0.05. That is not statistically significant, not even close. Instead of only running a simple year-to-year correlation, I ran an AR(1) intraclass correlation (with some help from Eric Seidman among others). Intraclass correlation is very similar to year-to-year correlation, but gives some extra credit to the correlation if a team is especially good at home in 2006 and 2008, but not in 2007. It looks at each team in general, rather than two consecutive seasons. The intraclass correlation was also only 0.05, which is not statistically significant either. From this, it seems very unlikely that any team has a significantly different home-field advantage than any other team, at least when looking at the last five years. Although there is clearly a distribution of home-field advantages that vary from team to team, that is exactly what should happen if no team has a larger home-field advantage than another. If this theory holds true, any team should be expected to have an eight percent home-field advantage next year on average, regardless of what their home-field advantage was this year. It will not be exactly eight percent, but would be just as likely to be above eight percent as below it. The last five years made sense as an initial starting point for looking at home-field advantage, because team composition does not change as drastically over a five-year span as it does over an even longer span. However, it is worth checking whether this holds true over a larger time period to see if maybe the smaller sample size is blurring an effect. I gathered the home-field advantage numbers for every team during 1998-2008 (the eleven-year time period in which there were 30 teams), and I attempted to discover whether there was any persistence to home-field advantage using that data; the correlation stayed low and insignificant, though it did rise to 0.102. The intraclass correlation only went up to .104 too, which is weakly statistically insignificant and slightly more noticeable. It seems pretty clear that if there is any persistence to home-field advantage, it must be a very small effect. Numerically, even if you see a team put up a home-field advantage of 18 percent one year, you probably would not even expect them to have a home-field advantage of nine percent the following year. As we will see below, that may even be too high as well. Although the correlations seem very low, I thought that it would be important to try some other angles to see if we can learn more about team-specific home-field advantage, if such a thing exists. The thesis that I am generating here is that the variance that we observe in home-field advantage is exactly what we would expect if every team had the same skill at creating a home-field advantage. Therefore, it makes sense to check a chi-squared test to see if the variance is in fact what we would expect. A chi-squared test allows us to compare the expected variance that we would expect if every team had an equal home-field advantage against what the observed home-field advantage was for the 1998-2008 period that we are considering. To generate the expected variance, I found the winning percentage of each team over the last eleven years, and calculated the variance of their expected home winning percentage minus away winning percentage, to see if their home winning percentage was about four percent above their overall winning percentage, and their away winning percentage was four percent below it. The expected variance would have been 0.0166 according to this estimate; the actual variance was 0.0195. The chi-squared statistic is therefore 34.1, which is statistically insignificant as well. So, we fail to reject the hypothesis that there is team-to-team difference in home-field advantage. In other words, the variance was only slightly above what we would expect if there was no such thing as team-specific home-field advantage. Despite this result, it seems pretty clear that each test shows a positive but statistically insignificant effect of team-specific home-field advantage, which means that perhaps it does exist on some level. Over the last eleven years, there is one team who has by far the largest home field advantage of any team in the league-the Colorado Rockies. They have having a winning percentage that is 15.4 percent higher at home than on the road. This becomes even more clear when we look at the following chart, in which I plotted the expected number of teams that would have approximately X percent of a home-field advantage over eleven years if there were no such thing as home-field advantage, as well as the number of teams that have approximately X percent of home-field advantage for 1998-2008. This makes it even clearer how anomalous the Rockies are:
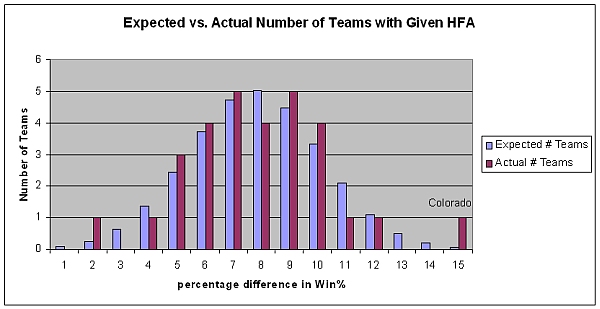 Notice that one would probably expect to see a team around two percent even though every team would expect to be at about eight percent on average. What you would not expect is for a team to be up at 15.4 percent, as the Rockies are. The explanation for why the Rockies are an anomaly has been given countless times; the overwhelming likelihood is that due to the difficulty in adjusting to the altitude and the difficulty in getting accustomed to playing at that altitude, the Rockies gain an advantage over their opponents. Whether this is their own strength in adjusting to their altitude, or their own weaknesses in adjusting to normal conditions is not clear, but it does seem like the Rockies are a different breed altogether, and they seem to break the model. Consider the year-to-year correlation for 1998-2008 without the Rockies-that clocks in at .065, which is nowhere near statistically significant. The intraclass correlation of .068 is even more insignificant than with the Rockies; it looks more and more like home-field advantage is not team-specific for the other 29 teams. Looking at it from another angle makes this even clearer. While excluding the Rockies, the expected variance of home-field advantage as described above would be 0.0160. Instead, it was 0.0138-even less than we would expect if the outcomes were random (though insignificantly so). The Rockies truly seem to be the anomaly. What this means is that to analyze home-field advantage, we should keep in mind that every team except for the Rockies has pretty much the same home-field advantage. Claims that crowds in different stadiums or that certain kinds of teams are more prone to have a home-field advantage are likely to be false, or more politely, below the threshold of statistical measurability. It is probably true that if you get a ground-ball pitcher or a power hitter in a small stadium, you are likely to increase your home-field advantage some, but these effects are probably extremely minor. It takes a long time for the difference between two similar percentages to show any kind of consistent trend, and that means that we should wary of explanations of why certain teams have home-field advantages after the fact. There has been a tendency historically for domed home teams to do well in domed stadiums, for example, but most similar explanations will not hold water. Although this result is perhaps somewhat shocking, it simplifies some of our analysis of home-field advantage for the rest of this series. We can now look for trends without worrying that our data is contaminated with large team-specific effects. As we have now delved into the question of what home field advantage is and who does or does not have it, the next step is to consider where it might be the strongest. Specifically, what kinds of games exhibit the largest home-field advantages? We will look at divisional matchups and both intra- and interleague matchups, and try to see if we can learn anything more about home-field advantage using those. In doing so, we can rest assure that we do not need to worry about certain teams (other than the Rockies) tricking us into reaching inaccurate conclusions, since it does not appear that the other 29 teams in the majors exhibit or enjoy any special home-field advantage.
Matt Swartz is an author of Baseball Prospectus.
|
Pet peave: The Santa Philly fans booed was so drunk he could barely walk straight, or at all. Philly has no "anti-Santa" agenda.
Pet peeve: Poor spelling. I probably deserve to have my rating decreased on this post. :)
I'm an actuary, I'm not so good with these letter things.
You probably could have begged the excuse of thinking so much about baseball, that you got the spelling confused with "Peavy"....but that's kinda a stretch.
Mountainhawk, don't worry-- I'm from Philly and I know the story about the drunk Santa understudy; I meant it sarcastically :)