 16 comments have been left for this article.
 BP Comment Quick Links

|

|
July 13, 2009 Checking the NumbersFive Things I Learned at the PITCHf/x Summit
This past weekend I had the pleasure of traveling to sunny San Francisco to take part in the second annual PITCHf/x Summit, a gathering of analysts, team executives, and the brains behind the operation itself. The ultimate goal of these congregations involves discussing interesting ways to utilize currently available information while simultaneously looking at future innovations and ways to enhance the entire system. The biggest takeaway of the whole trip has to be that, regardless of the multitude of data currently offered by Sportvision and MLB Advanced Media, enough revolutionary information is in the works to the extent that the analysts (myself included) who have been working with cutting-edge data for almost two years now nevertheless had to pick our jaws up off of the floor at times. On Friday, a brief meet-and-greet of sorts took place during which I had the chance to chat with Marv White, the Chief Technology Officer of Sportvision, Michael Fishman, the Director of Quantitative Analysis for the New York Yankees, and Dan Quill, Director of Application Development for the San Francisco Giants, among others. For people in front offices and outside them, the data that Sportvision has been providing has caused a seemingly never-ending stream of excitement. The PITCHf/x and HITf/x datasets have certainly paved new roads of valuable analysis and the number-and stature-of the attendees themselves certainly reflects that. The major festivities took place on Saturday, when the presentations and open discussions were held. In total, 12 presentations were made, ranging from Dan Brooks' talk on the accessibility evolution of PITCHf/x to Matt Thomas' application of photogrammetry to fielding, measuring how far a fielder ventures to glove a batted ball using data derived from actual photographs. While I would love to recap each and every presentation-you can download the Powerpoints from the Sportvision site itself-a few lent themselves to some very interesting discussions worth pursuing further in this forum. Physics Will No Longer Be Boring For many high school students, physics happens to be one of those required courses with low levels of interest and curiosity, and even lower levels of material absorption. The latter can largely be attributed to the lack of a common ground, something that can explain physics-related concepts by relating it to an area of interest for the students. For instance, I enjoyed statistics throughout my time in high school and college because the material could be applied to baseball. Unfortunately, few in the physics world, publicly at least, have incorporated the sports middle man. Paul Robinson, a teacher at the San Mateo High School, has taken notice of the bored, zombie-like faces incapable of mustering even a simple head nod when a discussion of the drag coefficients begins, and has set out to change the way his classes are taught. The f/x datasets house practically all of the pertinent information for someone in his position who wants to create more interesting problems. An example of a vector addition problem would be to find the initial speed, fifty feet from home plate, in miles per hour, given the initial velocity vector-the VX0, VY0, and VZ0 in the PITCHf/x output. The square root of the sum of the squares of those three components computes the initial velocity in feet per second, which then translates to miles per hour. When Robinson ran through the equations, his example resulted in an initial velocity of 84.1 miles per hour on a preselected pitch. Upon comparing the formulaic results to the data point found in his PITCHf/x spreadsheet, the "start_speed" in this specific area read 84.1 mph. The datasets also lend themselves to problems involving projectile motion as well as Newton's Second Law, in which force is determined to be the product of mass and acceleration. The information provided by Sportvision and MLB Advanced Media has not only paved the way for edge-of-your-seat, analyses but also more interesting ways of instructing on perhaps unpopular subjects. Initial Position + Distance Traveled = Advancements in Fielding Data On Friday I discussed two fielding systems at length, noting what they can and cannot provide, as well as some interesting uses to potentially parse more meaningful information. Well, fielding was mightily popular at the summit this year, and one of the more ground-breaking presentations came from Matt Thomas, whose methodology and suggestion not only induced admiration from the crowd for his efforts, but also the "how did I not think of that!?" reaction. Matt used photogrammetry-essentially the act of using captured photos to provide data-as a means of extracting the positioning data of fielders in different spots over the course of a play. When finished, a simple subtraction of the start and end points provides a tangible quantification of just how far a fielder had to move to capture a batted ball. Matt works for various statistics providers, stringing games for the St. Louis Cardinals. While in his spot behind home plate, he captures the image of the entire field before the first pitch is thrown. The image then gets loaded into your everyday photo program-like Photo Plus or Adobe Photoshop-and the cursor ventures over to the feet of a particular fielder. The program notes the x,y pixel coordinates on the picture itself, which Thomas records and corrects based on potential lens distortion from the camera. The angles of positioning relative to the first-base foul pole are also recorded. The pixel coordinates of the feet are then translated into field coordinates, and the process is rinsed and repeated when the ball in play enters the glove, either on a direct flight or a brief stopover on the ground. Once the pixel translation at the end of the play enters his spreadsheet, a simple subtraction informs on how many feet and at what angle the fielder traveled to get to the ball. Data like this provides an additional analytical layer. Instead of merely evaluating players based on out conversions in specific zones, analysts will be able to find the expected values of plays during which a fielder has to move a particular number of feet, at a particular angle, within the aforementioned zones. (If you think this aspect of the information is interesting, just wait until I get into Greg Rybarczyk's mind-blowing presentation.) Thomas's data has much more utility than its fielding metric-enhancement capabilities, also aiding in scouting reports. Though he only implemented this methodology throughout Cardinals games, a few of Matt's slides showed just how useful the positioning could be from a tendencies standpoint. Because the lineup spot of the hitter and the baserunning situation as well as the score are all recorded, Matt was able to show the difference in initial positioning for a fielder based on batting order. Third basemen under Tony La Russa averaged an initial position of 102 feet from home plate in the sample, but stood right in line with the bag, at 90 feet from home, when leadoff batters came to the plate. In fact, third base happened to be the only position that cheated in more for the leadoff hitter than the opposing ninth hitter. This sort of data can be further split based on handedness, and interested parties will be able to have custom-made defensive scouting reports based on managerial tendencies. Simply amazing. Don't Neglect the Time it Takes to Reach a Batted Ball Directly after Matt spoke, Rick Swanson took the podium, and piggy=backed off of the distance traveled discussion, incorporating the time factor. Though an understanding of how far a fielder traveled to field a batted ball is certainly important, we cannot ignore that fielders go about their work at different speeds; if Nyjer Morgan and Adam Dunn are ranging to their right for a ball 30 feet away, Dunn certainly isn't going to get there more quickly. Swanson proposed the idea of calculating the time it took to reach the ball divided by the distance traveled. If Jacoby Ellsbury roamed 55 feet in five seconds, that particular play would be scored as 5/55, or .091. If it took Dunn twice the amount of time to travel the same distance, his play would be the recipient of a .182. The lower the better in this case as the lowest scores will point to plays in which a fielder traveled a great distance in a minuscule time frame. Discussions arose revolving around the implementation of such information. Some argued that while every play should be tracked relative to this formula, only the extremes would be kept and used to evaluate fielding prowess. A few, myself included, took issue with this idea, because even the canniest can of corn might not be fielded exactly 100 percent of the time. By taking the expected values of each play, those converted into outs at a flawless success rate would be eliminated as a byproduct of the formula. Advocating the tossing out of data in a room full of data junkies elicited a response that was almost the schoolyard equivalent of talking poorly about someone's mother. Swanson discussed using rather arbitrary data points as cutoffs when no such need exists. If traveling 50 feet to record an out in ten seconds (or a reaction over range result of .200) boasts a 75 percent conversion rate, then any fielder who successfully records an out with similar data would be credited with .25 times the run value of the play. As was mentioned above, when plays are converted each and every time, the expected value added will naturally be zero, accomplishing the same goal without the need to arbitrarily dismiss data points. Fielders and the Compass Rose Both of the aforementioned presentations serve as the perfect segue into Greg Rybarczyk's suggestions about fielding, relying on his background in the Navy to incorporate absolute and relative bearings in the realm of fielding. Absolute bearing refers to a coordinate system in which one barometer exists. With regards to HITf/x, that barometer would be home plate, where balls hit at zero degrees are straight up the middle, with the first base line being 45 degrees from home and the third base line set at -45 degrees. Everything shares a center or focal point. Using the absolute bearing in this scenario places every batted ball on the same scale, streamlining the park translation process. Relative bearing refers to multiple barometers, and this was the key to Rybayczyk's suggestion. When fielders get in position at the start of a delivered pitch, not everyone is oriented in the same fashion. The diagram below, courtesy of Greg's presentation, brings this description to life:
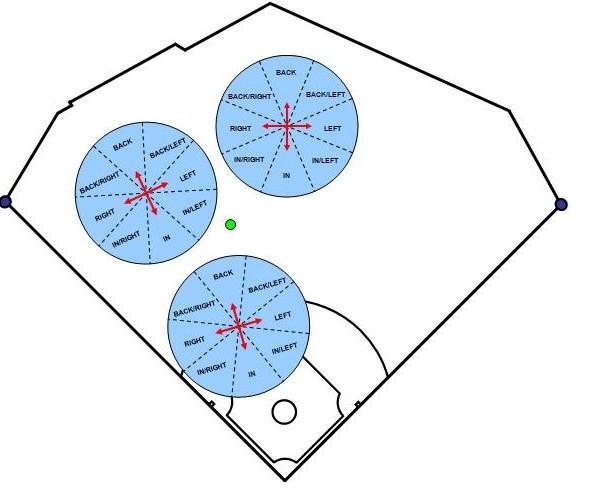 When the batter flares a ball to left-center-the green circle-the shortstop ranges back, the left fielder moves in and to his left, and the center fielder moves in and to his right. Just as fielders should be evaluated based on how far they travel and the time it takes to make their trip, so too should their fielding marks be somewhat contingent upon the necessary routes. It will take some time for the samples of data to become meaningful, but knowing the likelihood of a center fielder ranging to a ball 50 feet while going back and to his left in seven seconds is going to help create the ultimate fielding metric, which when coupled with PITCH- and HITf/x, will literally allow analysts to quantify everything that happens in a given game. GAMEf/x? Per a fantastic article in The New York Times, Sportvision and MLB Advanced Media are undertaking a project to install cameras at every major league ballpark not just to track pitches or the results of balls coming off of the bat, but rather the entire game. In the final presentation, Sportvision's CTO, Marv White, showed a demo of what the GAMEf/x system may eventually look like. This particular system would literally encompass everything that takes place within a given baseball game from a plethora of different angles. While watching the demo, several of us turned to each other in shock, because you could actually see the shortstop getting into position to receive the cutoff throw from the outfield, as the routes of baserunners were also on display. Not only were the pitches and batted balls tracked, with the pertinent fielder data as well, but every off the ball play was tracked. Every single aspect of the game would be quantifiable. It was and will be the motherlode. Conference Conclusion As you can imagine from reading some of these overviews, as tremendous as the data has been insofar as it has been increasing the granularity of analyses, we have not even begun to scratch the surface of what's possible. Much of our discussions with regards to FIELDf/x centered on different implementations and ways to incorporate each important aspect capable of furthering our knowledge of what makes or breaks a fielder. Just like the advent of HITf/x data will allow us to avoid predetermined batted-ball buckets like grounders, liners, and fly balls, partitioning balls put in play based instead on their speed off the bat and launch angle, the initial position of fielders and distance traveled, along with several other factors discussed at length will afford the opportunities to create expected value-based metrics relative to the specific situation at hand as opposed to solely utilizing fielding grids. This is not to suggest that the FIELDf/x system will make existing fielding metrics obsolete, but rather that it will greatly enhance information already in place. After enjoying myself immensely, I now plan on attending the summit each and every year, as the amount of information and ideas discussed with some of the brightest minds in the field gathered together is simply astounding. It felt like a meeting of world leaders� for those whose worlds revolved around baseball statistical analysis. Though I summarized several of the presentations, I highly recommend taking a trip to the web address above and reading through all of the covered topics. Trust me-you will be a lot smarter upon finishing. Special Thanks to Sportvision for holding such a wonderful conference, and to Greg Rybarczyk for the diagram on relative bearings.
A version of this story originally appeared on ESPN Insider
Eric Seidman is an author of Baseball Prospectus.
|
Does the installation of cameras to enhance Pitchf/x (or impliment GameF/x) also bode well for the television presentation of games? It seems like baseball broadcasters could take advantage of wider screens to provide several camera angles simultaneously, the main screen focused as it is now, but with smallers screens offering a birds-eye view to assess fielders' positions, one following baserunners, etc.
One of our discussions involved trying to determine interesting ways to implement the data. Right now it's all very raw, but the TV aspect could very well be an avenue they explore.