 25 comments have been left for this article.
 BP Comment Quick Links

|

|
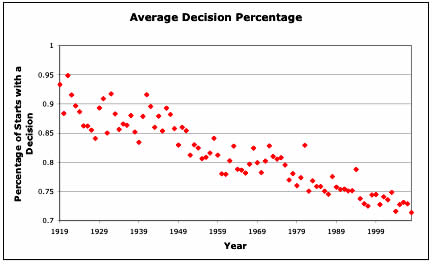
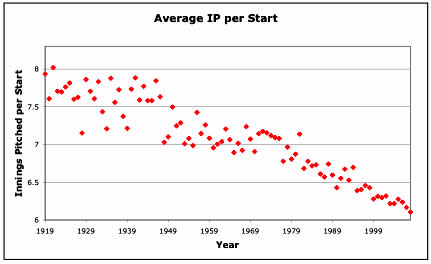
June 21, 2009 Prospectus Idol EntryDo You Hate Pitchers' Won-Loss Record? Blame Your Grandfather755, .406, 56. Each of those numbers probably triggers an image in your mind's eye. The timelessness of baseball's statistics is what makes baseball such an appealing sport to so many people, and what keep us interested long after the heroes of our youth have retired. Of the major American team sports, baseball is the one that most resembles the game our grandfathers played when they were children. Football? The forward pass had barely been invented. Basketball? There was no such thing as a dunk, a three pointer, or even a jump shot. Baseball has remained pretty much unchanged. Sure, the players today are bigger, stronger, and faster than those of the past, but the same is true of every other sport. Despite the players' changes, the balance of baseball is still roughly the same as it has been for 90 years, when Babe Ruth started hitting home runs and the dead-ball era gave way to the modern game. There have been fluctuations: the high scoring 1930s, the pitcher's era of the 1960's, the "PED era" of the last decade. Despite the ebbs and flows, scoring has generally remained close to 4.5 runs per game and league wide batting averages have hovered around .260. While the end result has stayed relatively stable, the way pitchers are deployed has changed dramatically. Pitcher usage has evolved to counteract the ever-improving hitter. Once a pitcher might have been able to coast through the bottom of the lineup, conserving energy for the heart of the order with little fear of giving up a home run to the #8 hitter. Today he must pitch carefully and near full effort throughout he lineup. As a result of the sustained higher effort and increasing strike out rates (with strikeouts always requiring at least three pitches), pitchers have completed fewer starts ever since the 1870s. As discussed in Baseball Between the Numbers and elsewhere, the rate of complete games has dropped from around 90% in 1893 when the pitching mound was moved back to its current distance to under 4% today. A second result is that the rate of decisions by the starting pitcher has also declined steadily with time. Since pitchers do not go as deep into games as they once did, their won-loss records are more susceptible to things beyond their control such as relievers blowing an inherited lead or teammates mounting a late innings rally. The earlier a pitcher exits a game, the less likely he is to earn the decision. Countless articles have been written about this in recent years, as analysts wonder if anyone will ever again reach 300 victories in a career. While the fate of the 300 game winner is well worth considering, another byproduct of the decline in decisions is the lack of correlation between pitcher wins and pitcher quality, particularly over a single season. The idea that wins are a poor way of measuring how good a pitcher is should not be novel to any reader of Baseball Prospectus. Indeed, most of us probably determined it was stupid as soon as we understood the rules, with thoughts along the lines of: "You mean that if a pitcher gives up one run in nine innings, but his teammates don't score he is considered to have pitched poorly?" Any number of people have come up with methods of measuring pitcher performance that correlate far better from year to year than actual wins and losses (such as SNLVAR, VORP, and QERA). Despite these advances, the won-loss record of a pitcher remains a critical tool for gaining recognition through the standard channels: All Star games, Cy Young Awards, and even the Hall of Fame. Why are wins and losses still so important in deciding who the top pitchers are? Blame your grandfather. At the end of the dead ball era in 1919, the top pitchers earned decisions in approximately 90% of the games they started. As the game has evolved and pitchers have been relieved earlier in games, that number has steadily declined, currently residing around 70%. Note that in order to consider only the top starting pitchers, I am restricting this study to pitchers who started at least 25 games and made 2 or fewer relief appearances.
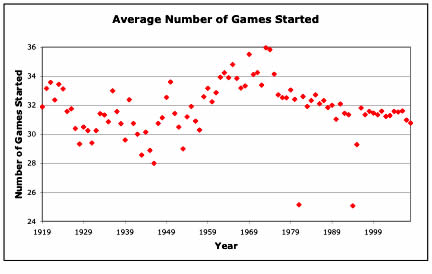
 When pitchers stayed in games longer and earned decisions at such a high rate, it was more likely that their won-loss record would correlate to their own performance, since the uncertainty that comes from turning a game over to the bullpen was removed. Run support obviously plays a large part in earning wins and losses, but wins could reasonably be construed as being a meaningful measure of pitcher performance in the 1920s, particularly when considering the lack of advanced metrics. Contrary to popular belief, the number of games started has not declined dramatically with time. It is true that today's pitcher average fewer starts than their predecessors in the 1960s. However, the 1960s actually represented an increase in the average number of starts by top pitchers since the 1920s.
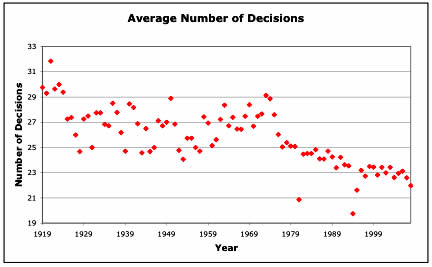
 As a result of the evolution of pitcher usage, the average number of decisions by a top starting pitcher today is its lowest value in history, excluding the strike-shortened years of 1981, 1994, and 1995. The average starter in 1919 earned approximately 30 decisions while the average starter in 2008 earned just 22 decisions.
 The upshot is that it is now much harder for elite pitchers to separate themselves from the pack. To illustrate this, consider the following table, which shows the expected won-loss records (eW-L) for pitchers whose statistics indicate they should win 80%, 70%, 60%, and 50% of their decisions (eW%) in 20-year intervals since the end of the dead-ball era.
          1920   1940   1960   1980   2000
eW%       eW-L   eW-L   eW-L   eW-L   eW-L
80%      24- 6  22- 6  22- 5  20- 5  18- 5
70%      21- 9  20- 8  19- 8  18- 7  16- 7
60%      18-12  17-11  16-11  15-10  14- 9
50%      15-15  14-14  14-13  13-12  12-11
The separation between the best pitcher and an average pitcher was about nine wins in 1920, but has been reduced to only six wins today. Since there is less of a spread between the elite pitchers and everyone else, it is easier for a lesser pitcher to get lucky and surpass the elite pitcher in wins. Baseball Prospectus has a metric called "luck" which measures the difference between a pitcher's expected wins and losses (definition: "Expected win record for the pitcher, based on how often pitchers with the same innings pitched and runs allowed earned a win or loss historically") and his actual wins and losses. Luck scores in a given season typically range from about -10 to +10, with most pitchers near 0. I collected the luck scores for all pitchers in 1960, 1970, 1980, 1990, and 2000 (luck scores only go back to 1954). The standard deviation in luck for pitchers with 25 or more starts was 4.2. For a luck score of 4, a pitcher one standard deviation in the positive direction would win roughly 2 games more and lose 2 games less than expected based on his statistics. Thus a pitcher whose expected record was 12-11 could be expected to go 14-9 about 13.6% of the time, 16-7 about 2.1% of the time, and 18-5 about 0.1% of the time. Talent in the major leagues is not distributed evenly. There are many more average players than stars, and far more mediocre players than average players. In theory, the talent can be approximated by an exponential function, however when considering only the better starting pitchers (again defined as those with 25 or more starts from the 1960, 1970, 1980, 1990, and 2000 seasons), the distribution approximates a bell curve when talent is measured by expected win percentage.
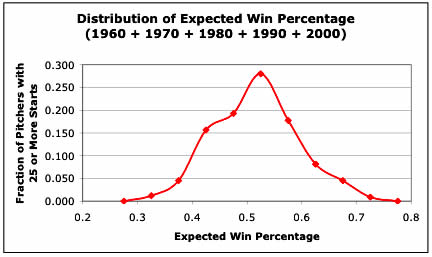 There are very few aces and many more pitchers in each progressively lower talent level. Presumably there are far more pitchers capable of winning less than 50% of their games...they just aren't allowed to make 25 starts in a season. The larger the pool of players, the more likely that someone will outperform his expected won-loss record by a substantial amount. Given enough players in the pool, it is reasonable to have someone outperform his expected won-loss record by three or more standard deviations. With the much larger number of players expected to win 50% or 60% of their games than 70%, it may not be unusual for a slightly above average pitcher to get lucky and lead his league in wins, beating out better pitchers with worse luck. I created a model to see how often this is likely to occur. For simplicity, I assumed that talent is distributed as in the histogram above and has been since 1920. Thus, 0.9% of pitchers were expected to win 70-75% of their games, 4.5% were expected to win 65-70%, 8.1% were expected to win 60-65% of their games, 17.8% were expected to win 55-60% of their games, and 28% were expected to win 50-55% of their games in each year (1920, 1940...2000). I assumed a constant luck standard deviation of 4.2 and generated 5000 random seasons to see how often the league leader in wins came from each talent category. The percentages are below:
          1920   1940   1960   1980   2000
ExpWpct  mostW  mostW  mostW  mostW  mostW
 70-75%   39.7   40.4   40.4   41.4   41.5
 65-70%   55.9   55.4   55.1   54.0   54.0
 60-65%    4.3    4.1    4.5    4.6    4.5
 55-60%    0.1    0.1    0.0    0.0    0.0
 50-55%    0.0    0.0    0.0    0.0    0.0
Surprisingly, the decrease in the number of decisions from 1920 to 2000 did not make much difference in the fraction of the time that the league leader in wins came from each talent group. In each era, the wins leader came from one of the top two groups about 95-96% of the time. However, these results reiterate that the league leader in wins will quite often not be the best pitcher; 59% of the time the wins leader will not be among the best 1% in expected won-loss record, and about once every 20 years or so, he will not be among the best 5.4% of starters. So what have we learned? As the game has evolved, starting pitchers are going less deep into games and earning fewer decisions as a result. This compresses the range of expected won-loss records, making it harder for today's top pitchers to distinguish themselves from the merely above average. Despite this, the variation in wins due to things beyond the pitcher's control is large enough that the league leader in wins is no less likely today to be the best pitcher than he was in the past. Wins definitely aren't the best way to judge a pitcher, but they probably aren't any worse now than they were when your grandfather was a boy.
|


I really like the use of graphs. As with Matt's article last week, the graphs and dense writing make it seem longer than it actually is, but unlike Matt, Matthew stays focused on one topic and pounds it mercilessly until we get to the conclusion. This is really solid work and the kind of thing that he's shown he can do week in and week out. Knight's not the best pure writer, but he's solid enough to hold his own with people that are. He's not that stathead that Kniker is or the writer that Swartz is, but he might be the best "middle ground" in the competition.