 34 comments have been left for this article.
 BP Comment Quick Links

|

|
May 23, 2009 Prospectus Idol EntryWhy is On Base Percentage King?The lesson that many people take away from Michael Lewis's best-selling book Moneyball is that On Base Percentage (OBP) is the only way to build a good baseball team. What is often missed is that the book is really a tale of economics, about finding inefficiencies in the market and exploiting them. In the late 1990s and early 2000s, the baseball market was inefficient at judging the value of OBP. Realizing this, the low budget Oakland A's were able to build a successful offense on the cheap. For better or for worse, the mantra "OBP is king" is often the first step an average baseball fan takes towards becoming a regular Baseball Prospectus reader. For those readers of Moneyball who are not convinced that Billy Beane wrote the book to praise his own genius, it should be obvious that it is better to get on base than to make an out. But why is OBP so important? To explore how OBP affects run scoring, I will conduct a thought experiment. A thought or "gedanken" experiment is an imaginary experiment that illustrates an idea or hypothesis that would otherwise be difficult or impossible to perform. These were particularly useful for 20th century physicists as they attempted to visualize revolutionary new ideas. Einstein was well known for his numerous thought experiments on relativity, and the most famous example from quantum mechanics is Schr�dinger's Cat, better known to many BP readers as the namesake of Dan Fox's column. In our thought experiment we will consider two teams, one made up of nine hitters each of whom has a 0.400 OBP and a second team made up of nine hitters each of whom has a 0.300 OBP. As an homage to two of the better known players from my baseball card collecting days, we'll call the 0.400 OBP team the "Rickeys" (Rickey Henderson had a lifetime OBP of 0.401) and the 0.300 OBP team the "Shawons" (Shawon Dunston had a 0.296 lifetime OBP). For simplicity we will think of each plate appearance for the Rickeys as resulting in 0.6 outs and 0.4 times on base. It doesn't really matter how the player reached base, just that he didn't make an out. Similarly, each Shawon plate appearance will result in 0.7 outs and 0.3 times on base. Since a nine inning game consists of 27 outs, we can determine how many plate appearances will be necessary for each team to accumulate 27 outs by dividing 27 by the fraction of each plate appearance resulting in an out. For the Rickeys, 27 outs divided by 0.6 outs per plate appearance yields 45 plate appearances. In 45 plate appearances the Rickeys will make 27 outs, leaving 18 times in which they reach base by a hit or walk. For the Shawons, 27 outs divided by 0.7 outs per plate appearance yields 38.6 plate appearances. We'll round this to 39, meaning the Shawons reached base 12 times before accumulating 27 outs. Clearly it is better to reach base more often than not, but how can we quantify how much better the Rickeys' offense is than the Shawons' offense? The best method would be to calculate the probability of each plate appearance ending in a single, double, triple, home run, walk, out... to estimate how many runs each offense should score in a given game, then playing the season out and repeating this with random numbers millions of times. While writing a computer code to run Monte Carlo simulations would create a more accurate model, the aim of this column is to introduce beginners to more advanced statistical concepts without utilizing much math. We can get a fairly good answer just by looking at pitching statistics that most readers will be familiar with from a typical fantasy baseball league: ERA and WHIP! Unsurprisingly, there is a correlation between ERA and WHIP; pitchers who give up fewer walks and hits usually allow fewer runs The graph below shows WHIP plotted against ERA for all pitcher seasons from 2000-2008 with more than 20 IP (thanks to http://baseball1.com/ for the raw stats). The straight line is a simple, unweighted least-squares fit to the data. Note that for particularly high WHIPs the results become non-linear, with more points above the line for a given WHIP. For our purposes the type of fit doesn't really matter, it is intended to guide the eye and show what a typical ERA is for a typical WHIP.
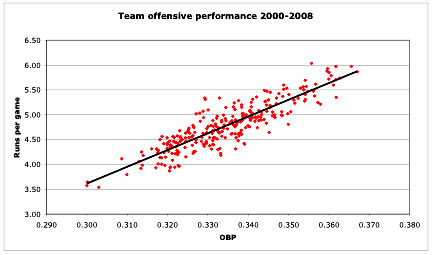
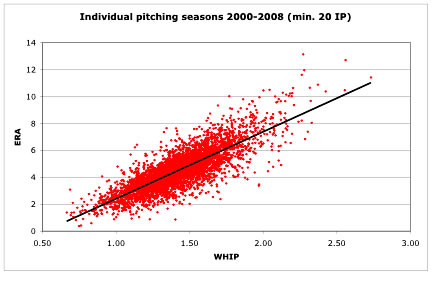 Returning to our two offenses, the Rickeys averaged 18 walks plus hits per 27 outs (9 innings), or a WHIP of 18/9 = 2.00, while the Shawons averaged 12 walks plus hits per 27 outs or a WHIP of 12/9 = 1.33. Without looking at the figure above, your fantasy baseball spidey sense is no doubt tingling at the sight of those WHIPs. Chances are a fantasy team whose pitchers sported a collective WHIP of 1.33 would be doing reasonably well, while most fantasy managers wouldn't consider using a pitcher with a WHIP of 2.00 for fear of the damage he would do to their team. Although�he would be a fantastic HACKING MASS player assuming he was used sufficiently! Looking at the figure, we see that from 2000-2008 pitchers with a WHIP of 2.00 typically had an ERA over 7 while pitchers with a WHIP of 1.33 had an ERA of about 4. In other words, a pitcher who allowed all opposing hitters to reach base at the rate of the Rickeys would have been among the worst pitchers in baseball, while a pitcher who allowed hitters to reach base at the rate of the Shawons would have been an above average pitcher (the average pitcher in the sample had an ERA of 4.52). There are very few data points for pitchers with a WHIP near 2.00, since pitchers who allow this many base runners do not last long in the major leagues. Thinking about ERA from the offense's point of view, our hypothetical Rickeys would score about 7 runs per game while the Shawons would score a much more modest 4 runs per game. A difference of 3 runs per game is a lot, but how many more games would the Rickeys win than the Shawons over the course of a season? Ideally we would take into account things like the number of runs each team allowed on defense, fluctuations in scoring from game to game, league wide scoring levels, etc. However, for our purposes, the sabermetric rule of thumb that an extra 10 runs scored or prevented will result in an extra win over the course of a season will suffice. Over 162 games, the Rickeys would score about 500 more runs than the Shawons. All other things being equal, the Rickeys would be expected to win nearly 50 more games! As a sanity check that this method is valid, the figure below plots the OBP and runs per game of every team season from 2000-2008, again with a least-squares fit to the data overlaid. While no team approached a 0.400 OBP, extending the line to an OBP of 0.400 predicts a team would score about 7.0 runs per game. A few did approach a 0.300 OBP: the 2002 Tigers (0.300), 2003 Tigers (0.300), and 2003 Dodgers (0.303). These offensively challenged squads averaged a paltry 3.6 runs per game. Despite reducing the discussion to common fantasy statistical categories, our estimate of the effect of OBP on runs scored proved very good!
 This thought experiment is clearly an exaggeration of how offenses are constructed. No team is likely to field a lineup with nine hitters capable of a 0.400 OBP, while only the occasional team is likely to be so bad as to field a team with nine hitters approaching a 0.300 OBP. However, it illustrates well the importance of conserving outs. If you want to score runs, OBP is king. Postscript: Call me CWebb. As a number of readers have pointed out in the comments to my initial entry, I was sloppy with my usage of BABIP when it should have been BA on contact. I am embarrassed to look so foolish on my first chance in the sabermetric spotlight. I know 1993 was Webber's second Final Four, but you know what I mean. It is a tremendous honor to be one of the ten BP Idol finalists, and I am grateful to all the readers who are holding me to the same lofty standards that they expect of the regular BP writers. I can't promise I'll never make another mistake, but I'll sure try. Hopefully I can follow this up with 15 more years of elite basketball...er baseball analysis.
|


This one actually surprised me. At first I was saying to myself, "oh no, not something else about how great OBP is," but then you took it in a pretty interesting direction, so as they say, way to make it your own.