 63 comments have been left for this article.
 BP Comment Quick Links

|

|
May 24, 2009 Prospectus Idol EntryPaper Covers Rock: Why Pitchers Don't Control Batting Average on Balls in PlayVoros McCracken wrote on Baseball Prospectus over eight years ago to release one of the most controversial findings in the history of sabermetric thought: he said that pitchers only control whether a hitter strikes out, walks, hits a homerun, or hits the ball in play, but have little to no control over whether a ball in play is a hit or an out. Many have argued that the reason this is true is because walks, strikeouts, and homeruns are outcomes that have nothing to do with defense. Anything else has the potential to land on the field or be caught beforehand, and so it is the defense's job to cover ground effectively. The pitcher had to keep the ball from being hit out of the park, or from being hit altogether. In that article, he states that pitchers control three main things: strikeouts, walks, and homeruns, and that pitchers who were above average in recording strikeouts, avoiding walks, and avoiding homeruns one year were frequently above average in those categories the following year. However, the pitchers who were above average at preventing high Batting Average on Balls in Play (BABIP) one year were no more likely to be above average at preventing high BABIP the following year than pitchers who were below average. BABIP is defined as follows:
 McCracken argued that the hitters the pitcher faced and the defense behind him were the key determinants in a pitcher's BABIP. Comparatively, a batter's BABIP not only shows a much higher year to year correlation, but you can also learn a lot through breaking it down by batted ball type. Correlation coefficients are a measure of how well two variables move together. These year-to-year correlations test whether pitchers' strikeout rates, for example, tend to be high if they were high the previous year (a positive correlation), low if they were high the previous year (a negative correlation), or no more likely to be high or low if they were high the previous year (zero correlation). Correlation coefficients take on values between -1 and 1, where a correlation of 1 means that the two move together in perfect unison, 0 means that they are unrelated, and -1 means that the two always move in opposite directions. Look at the following table stating the year-to-year correlations for each of the following statistics using 2003-2008 data on the pitchers who threw at least 100 innings in consecutive seasons.
PITCHERS' STATISTIC                        CORRELATION WITH SAME STATISTIC
                                           THE FOLLOWING YEAR
Strikeouts per Batter Faced                .7686
Unintentional walks per Batter Faced       .6682
Homeruns per Batter Faced                  .3769
BABIP                                      .2242
Pitcher's BABIP minus overall team BABIP   .1490
As you can see, pitchers do seem to have some persistence in their BABIP, but a large portion of that correlation is actually the defense behind him that keeps the whole team's BABIP low or high (as shown by the fact that the BABIP correlation is smaller when you only consider the difference between the pitcher's BABIP and that of all pitchers on his team). Hitters seem to control their BABIP a lot more. Check out the same table for hitters who had 300 plate appearances or more in consecutive seasons from 2003-2008.
HITTERS' STATISTIC                         CORRELATION WITH SAME STATISTIC
                                           THE FOLLOWING YEAR
Strikeouts per Plate Appearance            .8467
Unintentional walks per Plate Appearance   .7751
Homeruns per At-Bat                        .7420
BABIP                                      .3657
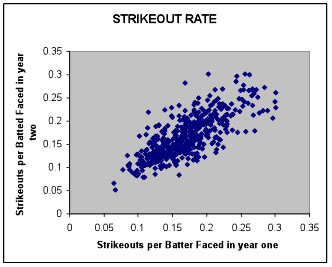
The following two diagrams illustrate this point pretty well. The first graph shows pitcher's strikeout rates one year versus the next year. As you can see, the pitchers who had low strikeout rates one year had low strikeout rates the next year.
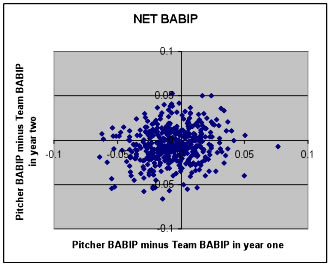
 This graph shows the difference between a pitcher's BABIP and his team's overall BABIP allowed in one year compared to the same difference the next year. It does not seem like being vulnerable to hits on balls in play one year makes you any more or less likely to be vulnerable to the same thing the next year.
 If you try to explain this concept to the average baseball fan, you'll get some funny looks. After all, it goes against all common understanding of the game. How could a pitcher not really affect his BABIP? Pitchers who have good stuff must be able to induce weak contact, right? It goes against logic, and while we can look at the numbers and see it is true, you are likely to get a response like "oh, you can manipulate numbers to tell you anything." When you go to a ballgame and you see the visiting team blast a line drive into the gap, you blame the pitcher, don't you? This is where the problem lies. If he left a meatball over the plate, it seems like it is probably his fault. McCracken himself has since softened his stance and most sabermetricians in the know generally believe that pitchers have some control over BABIP, but very little. They certainly do not seem to have any special ability to avoid line drives-the correlation in my sample between line drive rates one year and the next is 0.00! In fact, old BABIP data is nearly irrelevant in predicting their performance because it is correlated with the other factors, like strikeout and homerun rates, which matter more. Groundball rate is somewhat correlated with BABIP (positively) only because flyballs that are not homeruns are more likely to be turned into outs than groundballs. The correlation is not all that high (.11), and is barely far enough from zero to assume there is a real correlation. There is also a slight negative correlation (-.18) between a pitcher's strikeout rate and his BABIP the following year, too. In reality, the question is why BABIP has such a poor correlation for pitchers. To project future hitter performance, not only is it useful to know his homerun, walk, and strikeout rates, but it is important to know his BABIP. However, to project future pitcher performance, it is still useful to look at his homerun, walk, and strikeout rates, but knowing his BABIP will not help the projection at all. When projection systems like PECOTA make ERA projections that turn out to be accurate, even though they do not seem in line with the previous year's ERA, they are using a trick-they are mostly using strikeouts, walks, and homeruns to predict ERA, and are not using last year's ERA much at all! Of course, the pitcher does seem to have a little tendency to control BABIP, but that effect is captured by looking at his strikeouts and groundball rate. If hitters had a high BABIP against him the year before, that might be an accident. It's best to look at how many people he struck out and that will tell you whether he can induce weak contact better than how much weak contact he caused last year. There is clearly a dilemma here. On one hand, we see a meatball lined into the gap, and we know the pitcher probably messed up. On the other hand, we keep looking at all these numbers that tell us pitchers who give up a lot of line drives are no more likely than other pitchers to give up a lot of line drives the next year. What gives? The concept is no more complicated than rock/paper/scissors. If you have ever played rock/paper/scissors before, you know that you can't keep doing the same thing over and over, and you can't be any more likely to do rock, paper, or scissors at any given time. You need to randomize. In game theory, we call this approach a mixed strategy. When it comes to pitching, we know that if a pitcher threw a fastball on the outside corner every single pitch all year long, the hitters would eventually discover this and start hitting the ball the other way. The result would be a lot of opposite field hits and a high BABIP. Pitchers who are predictable get told by their coaches to "keep the hitter honest." What they are saying in game theory terms is "play a mixed strategy." Even if you are a little predictable one day, you can switch your approach. The result is that sometimes the pitcher throws an 0-2 fastball right down the middle and the hitter is caught looking. Pitchers are taught to randomize their pitches and locations, and as a result, a line drive often comes from a hitter guessing right. Chipper Jones recently said, "For me, plate discipline is being able to know what pitch you want to put in play before you step in the box and not swinging at anything else but that." That is certainly one way to guess right, and that's why Chipper Jones' BABIP has been .343, .352, and .388 compared to league averages of around .300 in the last three years. For pitchers, the best way to have a low BABIP is apparently just to face Chipper Jones less. It's not that pitchers don't control BABIP-it's that pitchers barely differ in their abilities to control it, because the only control they have is to try and stay unpredictable.
Matt Swartz is an author of Baseball Prospectus.
|


This is one of this week's better ones for me. Two things really stood out. The first was the graphs. I hate graphs for graphs sake, but those really told a story with the straight line contrasting the random scatter plot. The second thing is your last paragraph, which was fantastic.