 17 comments have been left for this article.
 BP Comment Quick Links

|

|
May 15, 2009 Checking the NumbersDissecting the Enigma
Remember the movie Weird Science, where Anthony Michael Hall and a friend engineered the perfect woman with the help of an outdated computer? Imagine for a moment if that movie were to be remade, and the two main characters were general managers of baseball teams, seeking the ideal pitcher rather than the dream girl. This pitcher would have to possess some incredible characteristics, like being consistently capable of logging a high number of quality innings each and every year. He would exhibit solid control and command, fanning lots of batters while walking very few. He wouldn't get hit around much either, as the combination of velocity and movement on his pitches would elude the opposition, leading to quality WHIP rates. Above all, he would have supreme confidence in his repertoire and an ability to throw a variety of pitches in any given count. Place this pitcher in the major leagues, and he would appear in numerous All-Star games, place perennially on Cy Young Award ballots, and find himself on the fast track to Cooperstown. Over the last ten seasons, only two pitchers have been durable enough to reach 2,000 or more innings thrown-an average of 200 IP per year-while simultaneously posting a strikeout rate north of 8.0 and an unintentional walk rate under 2.5. One of those pitchers is Randy Johnson, a first-ballot Hall of Famer and arguably the most dominant southpaw starter of the last quarter-century. The other pitcher happens to be Javier Vazquez, who is not going to Cooperstown, and who will be lucky to be remembered as anything other than frustrating long after he's thrown his final pitch. In addition to sporting very solid controllable skills, Vazquez throws two different types of fastballs, and is one of the few pitchers to throw three different off-speed pitches with a frequency exceeding ten percent. All of these offerings feature plenty of movement with deceptive velocity that sneaks up on hitters. Quite simply, he has some of the best raw stuff, yet he has never been able to truly reach the perceived potential that someone with that stuff is expected to. This failure to launch is particularly disappointing given that those in similar straits usually settle for being average while having the ceilings of very good pitchers; Vazquez was always known to have a superstar ceiling. Though several pitching coaches have tried their hand at turning him around, his inability to reap the benefits that his skill set would suggest has persisted. Several analysts and broadcasters have opined as to why he is merely a good pitcher and not one of the greats, the most common of which involves his drastic drop-off in results with runners on base. These results stem from two major roots: the strand rate and the difference between FIP and ERA. The league-average rate of stranding runners is right around 72 percent. Just as with BABIP, pitchers with significantly higher or lower rates are expected to regress over time. A higher strand rate signifies that the pitcher performed ably with runners on base, regardless of how many runners actually reached base. The ideal pitcher would allow very few baserunners, and have a strand rate well above average. Suffice to say, if a pitcher has a very low strand rate, he does not perform well with runners on. Vazquez's career strand rate is slightly below average, which tends to disprove claims of his ineptitude with runners on. It doesn't save him from a trip to the principal's office, though, as Javy has experienced a vast disconnect in his ERA and FIP, indicating that his skill set is strong, but that the actual results do not necessarily match up. The chief suspect in this ERA-FIP disconnect is his performance with runners on base, as he'll not allow that many baserunners, but those that do get on have a better than average shot at scoring. Unfortunately, when those running the numbers offer up his bases-empty vs. runners-on splits, the context is seldom discussed. Per my diatribe last week, context is of the utmost importance when dealing with split results, since it helps to determine if the numbers of an individual are significant or in line with the spread of the league. Here are Vazquez's splits in this area over the last ten seasons: Vazquez K/9 UBB/9 K/UBB HR/9 AVG/ OBP/ SLG EqA Empty 8.7 2.0 4.4 1.2 .245/.288/.405 .698 Runners 7.1 2.4 3.0 1.2 .275/.326/.447 .796 He strikes out over one and a half fewer hitters with runners on base, which, when coupled with a modest uptick in free passes issued, leads to a much lower strikeout-to-walk ratio. How does this compare with the rest of the league over this same time period? Below are the numbers for all pitchers with at least 500 innings over the last ten seasons. League K/9 UBB/9 K/UBB HR/9 AVG/ OBP/ SLG EqA Empty 7.0 3.0 2.5 1.2 .260/.322/.419 .746 Runners 6.0 2.9 2.2 1.0 .270/.336/.426 .789 And here is a comparison of the deltas derived from subtracting the runners-on statistics from those accrued with the bases empty. For the strikeout rates, negative numbers imply a worse performance with runners on; positive numbers imply the same for the other metrics. The standard deviations for the league can be found underneath the deltas, in order to illustrate just how far Vazquez strays from the average relative to the group.
          K/9  UBB/9  K/UBB  HR/9    AVG/ OBP/ SLG   EqA
Vazquez  -1.6   0.4   -1.4    0.0   .030/.038/.042  .098
League   -1.0   0.0   -0.3   -0.2   .010/.014/.007  .043
St. Dev   0.6   0.5    2.2    0.2   .018/.018/.035  .045
These numbers tend to suggest that Vazquez certainly performed worse than the league with runners on base, but he fell within one standard deviation of the mean for most statistics. Assuming a normal distribution, two-thirds of a data set will fall within one standard deviation of the mean. Looking at the strikeout rate, the standard deviation of 0.6 indicates that roughly 173 of the 260 pitchers qualifying for this sample saw shifts with runners on base ranging from better by 0.4 strikeouts to worse by 1.6 strikeouts. At -1.6 in the K/9 department, Vazquez strayed from the mean by exactly one standard deviation. Though this might not seem like much, the deviations themselves are quite large, and they definitely shed light on his struggles when runners reach base. His slash-line stats skyrocket as compared to the rest of the league. Surrendering more hits while not being able to cut back on his home runs allowed, combined with an increase in walks and a decrease in strikeouts, leads to a much worse pitcher with runners on base, especially relative to the splits of the league. Vazquez actually ranks 25th with his .098 discrepancy in Raw EqA, towards the top but by no means at the peak. The biggest such perpetrators are Eric Milton at .153, and Mark Redman at .152. Interestingly enough, both had identical .724 marks with the bases empty, and shot up to .877 and .876 respectively with runners on. Another statistical tidbit tossed around with regards to this split is that 41 percent of the home runs allowed by Vazquez in his career have been served up when runners reach base. Though that seems like a hefty percentage, the pitchers comprising this sample collectively allowed 41 percent of their home runs with runners on base, so Vazquez is actually in step with the league average on this front. What could lead to these drastic struggles with men on? Thankfully, the Pitch-f/x data set allows us to veer off onto previously blocked side roads. Perhaps his pitch selection differs dramatically with runners on. Maybe he throws with less velocity and/or movement. And does his overall release point really change on specific pitches, as White Sox broadcaster Hawk Harrelson has suggested? Beginning with the latter, the diagram beneath this text displays Vazquez's home release points in 2008 for his various pitches:
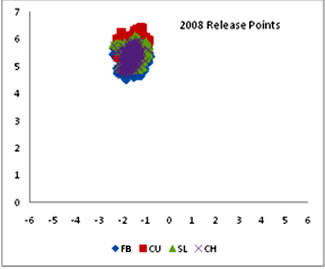 Same data, 2009 edition:
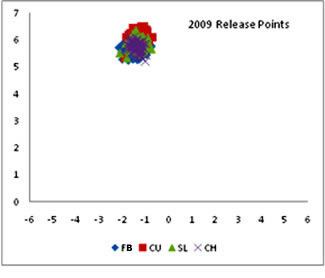 Both charts confirm Harrelson's assertion; Vazquez indeed throws breaking pitches at different slots than his fastballs. In spite of the differing slots, he has a much more clustered release through seven starts this season. The numbers below show the deltas in the vertical release-point component of his off-speed pitches relative to the heater:
Relative to Fastballs
       '08 Delta  '09 Delta
Curves      0.64       0.43
Sliders     0.23       0.26
Changeups  -0.36       0.10

Showing the z0 deltas of off-speed pitches relative to fastballs.
Both his two- and four-seam fastballs were delivered from the same release point, enabling the heaters to be condensed into one category, which aids in prior-year comparisons since the system did not differentiate between fastballs. How significant are these different release points? Keep in mind that vertical release is measured in feet, so the discrepancies are in fractions of feet, or inches. Vazquez delivers his slider at a release point 0.25 feet, or three inches, higher than his fastball. His curveball starts its journey toward home plate at a slot 0.40 feet, or 4.8 inches, higher than the fastball. This happens to be an area of research ripe for the picking, and it's therefore worthy of more than a mere paragraph. Vazquez has certainly shown an inconsistency in the location of his pitch releases, but the context of the league is of interest here, as is the significance of the deviations. It may seem to make perfect sense to suggest that different release points for certain pitchers can work as a tell, notifying the opposition of which offering is on its way, but my pinky is about two inches in length; do you really think that a major league hitter can decipher a release point one Seidman-pinky higher or lower than the average, from over 60 feet away, with all of the emotion and fast-paced action taking place? Seems very unlikely. We tend to equate shifts in release points to the extremes, picturing a pitcher throwing an overhand fastball, a three-quarter delivery slider, and a submarine changeup. This simply does not occur, and despite Vazquez's differing slots, the extent to which they matter is still an unknown. We cannot automatically write it off as meaningless, but we should chalk it up as a question that merits proper research rather than jumping to our conclusions. His other pitch data is less ambiguous, however, and can be split. Here is his repertoire breakdown over the last two seasons, in the split of major interest in this discussion: Bases Empty 2008 2009 Fastball 55.9 55.9 Curveball 14.5 15.4 Slider 18.1 15.2 Changeup 11.5 13.4 Runners On 2008 2009 Fastball 52.0 45.1 Curveball 9.9 15.8 Slider 23.4 21.2 Changeup 12.9 17.9 Last season, Vazquez held relatively steady with fastballs when runners reached base, but he supplanted his curves with sliders. This season, however, he has cut back on a decent percentage of fastballs with runners on, and replaced them with sliders and changeups. Perhaps the 2008 statistics are more indicative of his usual approach, while he has shaken things up this season. Or perhaps this is all just random given that Vazquez has made only seven starts. Finally, take a look at how Vazquez's velocity, movement, and location shifts with runners on:
                 FB Velo  FB PFX  FB PFZ  Middle
Bases Empty '08    92.1    7.28    9.45    29.3
Runners On  '08    91.6    7.79    8.63    27.6
Bases Empty '09    90.2    6.68    9.09    22.3
Runners On  '09    90.5    7.19    8.33    26.3

Middle = % of pitches thrown down the middle
During both seasons documented above, Vazquez saw minimal discrepancies in velocity with runners on, but he has thrown his fastballs with more horizontal and less vertical movement. This season, he has ventured too close to the no-no area of the plate more often with runners on, which certainly explains at least a portion of what transpires when he struggles. His middle-of-the-plate percentages this season are down from a year ago, however, when, despite missing the middle more often with runners on, both percentages were above the 26 percent league average. Now, you may have noticed that this pitch data has been provided free of context or any rant from my end. While velocity or movement comparisons to the league can be made, primarily looking at how others fare with runners on, our sample of comparables would be quite small once we control for the various factors that separate pitchers from one another. For instance, we would need to pool together pitchers with the repertoires who throw their pitches with similar frequencies, velocity, and movement, perhaps even with similar release-point discrepancies between the various pitches. By the time these factors were all controlled, you would have to forgive me for avoiding any type of definitive claim based on comparisons to only a handful of pitchers. Until more data enters the sample, we will have to settle for evaluating Vazquez's pitch-data splits relative to his own context. Yes, he performs worse with runners on base, especially relative to the league average, and he definitely changes his approach, but we are left wondering whether or not sticking to his bases-empty guns would produce different, and more positive, results. Whenever I think of Javier Vazquez, the old adage of "fool me once, shame on you; fool me twice, shame on me" comes to mind. He has consistently shown an ability to pitch well for several innings before falling prey to a glut of runs all at once. The fact that he has continued to pitch this way says more about those with decision-making powers than it does about his abilities. His pitching style seems to be come with the characteristics of a jerk boyfriend who every girl believes she can change. As every fifth inning passes with the opposition held in check, managers must think that Javy has finally turned a corner. A walk, a single, and a dinger later, and his masterful outing has transformed into one of merely moderate quality. It's time to accept that he is what he is, a very good pitcher who has, for eleven seasons, been unable to turn that superstar corner and avoid the big inning. Managers would be wise to keep him on a very short leash once runners begin to reach base toward the back end of his outings, but something tells me that Vazquez will continue to hypnotize skippers into leaving him in. These hurling hypnotics, however, will continue to end in frustration for all involved. After a while, windows close and corners can no longer be turned. Vazquez's time for both has expired, even though some will claim otherwise and do whatever they can to sustain the futile process.
Eric Seidman is an author of Baseball Prospectus.
|
If I were Bobby Cox the rule I would follow would be to pull Javier as soon as two runners reach in the sixth inning, or one runner reaches in the seventh or later.
Actually that sort of rule should apply to most starting pitchers. But there are a few special ones you would want to relax them for. Javier does have the stuff that suggests he might belong to the special group, but his performance over a long period suggests the rule applying to "ordinary" starters also applies to him.
Exactly... that's what I meant by hypnotics. He looks like he SHOULD be able to get through the frame but he won't, and history confirms this. I agree with your rule... I don't care if he has a 2-hit shutout going, if he lets 2 guys on in the sixth, pull him.