BP Comment Quick Links

 | |
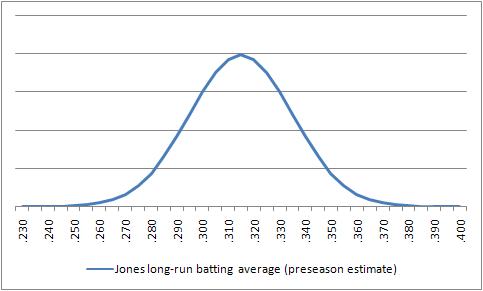
June 11, 2008 Lies, Damned LiesChipper's Chase of .400Chipper Jones is not a .400 hitter. However, that doesn’t mean that he won’t hit .400. What we have on our hands is a classic case of the irresistible force against the immovable object. On the one hand, it’s exceptionally unlikely that a player who has hit .310 over a 15-year major league career suddenly woke up one morning at 35 years old and became a .400 hitter. Jones is seeing the ball exceptionally well, and apart from frequent problems with injury, he has aged relatively gracefully. He’s also undoubtedly squeezed a few lucky hits in between the shortstop and the second baseman, and had a few Texas Leaguers drop in. On the other hand, it is also exceptionally unlikely that a player who is really and truly “just” a .310 hitter can hit .420 in 219 at-bats based on luck alone. Just how unlikely? The probability of a .310 hitter getting at least 92 hits in 219 tries is 0.023 percent—that’s a one-in-4,423 chance, for those of you who like your odds Vegas style. The truth, then, lies somewhere in between, but we’d like to know exactly where in between it lies. To finish with a .400 average, Jones is going to have to hit about .385 for the rest of the season. If, say, he really is closer to a .370 hitter than a .400 hitter, that is well within the realm of possibility. If on the other hand Jones’s talent is closer to that of a .320 hitter, then he has his work cut out for him, and he’ll have to do the equivalent of win the lottery twice in a row. To answer whether .400 is doable, let’s break down the problem into its two essential steps. Step 1. Estimate Jones’s true level of talent. By “true level of talent,” I mean what Jones would hit if you gave him an infinite number of at-bats, devoid of the vagaries of luck and small sample sizes. Before the season began, we had some rough notion of what Jones’s level of ability was, based on the performance of the comparable players in his PECOTA forecast. This took the form of a bell curve, centered around Chipper’s usual batting averages of about .310 or .320, but with some higher and lower figures possible. (A technical note to my regular readers: what you see in the chart below is not our usual way of doing a PECOTA forecast. Instead, I have generated a normal distribution based on the performance of Chipper’s comparables, after regressing the comparables’ batting averages to the mean).

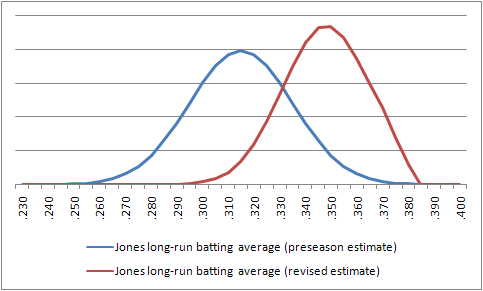
At this point, however, we have significantly more information about Chipper than we did at the start of the season. Information like the fact that Chipper really, really knows how to hit a baseball. So the idea is to come up with a new estimate of Jones’s talent that incorporates what we’ve learned about him this year. The process for doing this is a little involved, and requires the use of something called Bayes’ Theorem, but the basic intuition is as follows: sure, it seemed unlikely at the start of the season that Jones was a .360 hitter. But we also know that it’s much, much likelier for a .360 hitter to sustain a .420 batting average over the first ten weeks of the season than it is for a .310 or a .290 hitter. What Bayes’ Theorem gives us is a way to balance these two pieces of information. (I’ve used this process before to evaluate hot and cold starts, and it’s proven to have pretty good predictive power.) Sparing everyone some math, our solution from Bayes’ Theorem is that Jones is really and truly about a .350 hitter—specifically, our estimate is that he should hit about .348 the rest of the way out. There is some uncertainty around this estimate, because it’s plausible that Jones has become a .360 or a .370 hitter who has gotten a little lucky, and it’s also very plausible that he’s still more like a .320 or .330 hitter who has gotten a lot lucky. What we can say almost for certain is that Jones isn’t really a .400 hitter, but that he’s also almost certainly better than the .310-.320 range we pegged him at before the season began.

Step 2. Estimate Jones’s likelihood of hitting .400 based on his true level of talent. Now that we have some better idea of what Jones is likely to hit over the medium term, we can take a fair crack at the short term. How likely is Chipper to stay hot enough to finish the season with a .400 average? This process was taken care of by a simulation I designed, in which we played out the rest of the season 1,000 times. The way that the simulation worked was as follows:
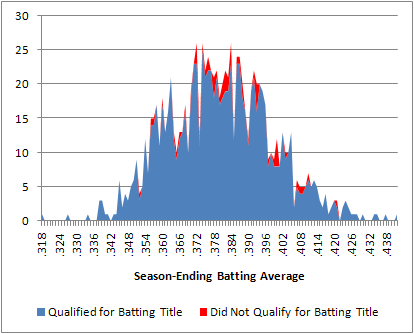
Overall, out of our 1000 simulations, Jones hit .400 or better and had enough plate appearances to qualify for the batting title 125 times. So this is your answer: I estimate that Jones has about a 12-13 percent chance of finishing with a .400 average. On six additional occasions, Jones finished with a .400 batting average but missed qualifying for the batting title due to injury; these results are not counted toward his total.

Chipper’s highest batting average in any one simulation run was .438 (!); his lowest was .318. His average season-ending figure was about .378. So, whether or not Jones finishes above the .400 mark, he is more likely than not to hit better than .372, which would be the best figure recorded thus far in the aughts (the record is shared by Nomar Garciaparra and Todd Helton). Overall, this paints a somewhat brighter picture for Chipper's batting average than I was anticipating. There are undoubtedly some elements of luck in Chipper’s performance to date, but he’s run too far ahead of the curve for too long into the season for us not to take it at least somewhat seriously. With a few more timely hits, and perhaps a fortuitous 15-day injury or two, this might prove to make for the most exciting individual pursuit of a record since 1998.
Nate Silver is an author of Baseball Prospectus.
|
Interestingly, since this article was published (June 11) to the end of the year, Chipper batted .309 (http://www.baseball-reference.com/players/gl.cgi?n1=jonesch06&t=b&year=2008&share=1.94#1955-2023-sum:batting_gamelogs), which is mighty close to his career average coming into 2008.