BP Comment Quick Links

 | |
February 29, 2008 Lies, Damned LiesThe New-Look PECOTA CardsOne of the trickier elements of forecasting the performance of baseball players is resolving the ambiguities between playing time and performance. Only a small handful of players-established stars in the prime of their careers with unblemished injury track records-are essentially guaranteed an everyday presence in their lineups. In drafting our fantasy depth charts and reviewing both PECOTA and each player's bill of health, we felt comfortable assigning a full 95 percent contingent of playing time to just 12 position players: Derek Jeter, Alex Rodriguez, Grady Sizemore, Miguel Cabrera, David Wright, Jose Reyes, Jimmy Rollins, Hanley Ramirez, Ryan Zimmerman, Ryan Braun, Albert Pujols, and Matt Holliday. Similarly, only 17 pitchers were assigned at least 200 innings. For most everyone else, the contingencies of injury, benching, or being forced into a time-share or platoon arrangement is a constant threat. If playing time and performance level behaved independently from one another, this would not be such a problem. We would have to forecast a player's rate statistics through some or another algorithm, and his playing time by another, and we could multiply those numbers together to produce his counting statistics. However, it is not quite that simple. Consider the following:
In other words, playing time and performance are correlated in a number of profound ways. If we are not careful, these relationships between playing time and performance level may lead us to misevaluate players. For example, say that we have a pitcher. Someone like Matt Cain, who has some breakout potential, but also some red flags in his performance record and perhaps some risk of injury. Let's say that this pitcher has an equal likelihood of having one of exactly three sorts of seasons (equivalent to three PECOTA comparables): Scenario IP ERA VORP #1: Breakout Performance 250 2.50 83.3 #2: Average Performance 150 4.00 25.0 #3: Injured & Crappy 50 5.50 0.0 If we take the mean of the three numbers for IP and ERA, we wind up with an average 150 innings and an ERA of 4.00. As we see from the table above-these averages happen to exactly match scenario #2-this would equate with a VORP of 25.0. So, our forecast for Matt Cain's VORP should be 25.0. Or should it be? What if, instead, we directly take the average of the VORPs from the three scenarios above, ignoring the IP and ERA components. This gives us: (83.3 + 25 + 0) / 3 = 36.1 That is, an average VORP of 36.1, which is a materially different estimate. Which number is right? Actually, it should be fairly clear that the latter number (36.1) is right. Since that comes from a direct estimate of Cain's VORP between the different scenarios, there is no need to fool around with the component statistics that produce that VORP. In fact, there is another way to arrive at this number that resolves the apparent discrepancy. This is by weighting our estimate of Cain's ERA based on the number of innings pitched under each scenario; that would be: (250 x 2.50) + (150 x 4.00) + (50 x 5.50) / (250 + 150 + 50) = (1500) / (450) = 3.33 This is essentially the technique PECOTA uses in formulating its weighted mean estimates. It would give us an ERA of 3.33 over 150 IP, which happens to work out to a VORP of 36.1-exactly the same number we'd get if we averaged the VORPs from the three scenarios directly. Because our weighted mean estimates are weighted based on the playing time for each comparable player, and because playing time and performance levels tend to be positively correlated, the weighted mean forecasts usually yield more optimistic estimates of a player's value than the median or 50th percentile forecast. But they also tend to give a truer picture of a player's prospective valuation, and that is why we recommend using the weighted mean estimates for most purposes. Indeed, one significant advantage of using a comparables-based projection system is that we are able to account for nuances such as these. Up until now, however, we have kept this dirty work mostly behind the scenes. But this year we have decided to "show our work" by creating a new chart that makes the relationship between playing time and performance much more explicit. Those are the funny charts you see on the PECOTA cards that look like this: Figure 1. Derek Jeter
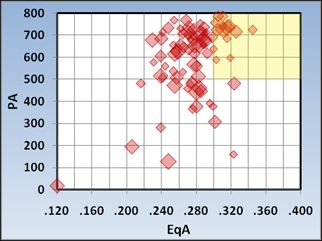 That's Derek Jeter's BSP Chart. What does BSP stand for? It is an acronym for bloodstain spatter pattern, which, as a friend who was assisting me with the design of these charts pointed out, these graphs seem to bear an eerie resemblance toward. What the BSP charts do is to plot a rate performance statistic (EqA or EqERA) on the one axis and playing time on the other (PA or IP). Each of the diamonds you see represents the performance implied by one of a player's comparables; the higher the similarity score for that comparable, the larger the size of the diamond. There is also an area of the chart shaded in a yellow color; this is the 'golden zone' of performance in which a player both performs well (an EqA of .300 or higher) and remains in the lineup frequently (at least 500 plate appearances). Pitchers actually have two golden zones, one each for roles as starting pitchers and relievers. What does Jeter's chart tell us? Well, that he's actually a fairly high-variance performer at this point in his career. There is both a fairly wide spread in his rate performance-anything from a .260 EqA through a .320 EqA would be fairly normal-and in his playing time, with a reasonable number of his comparables ending up below 500 plate appearances, presumably as the result of injury. Indeed, perhaps we should not have felt so safe assigning Jeter 95 percent of the Yankees' shortstop playing time in the first place. Compare this to someone like Miguel Cabrera: Figure 2. Miguel Cabrera
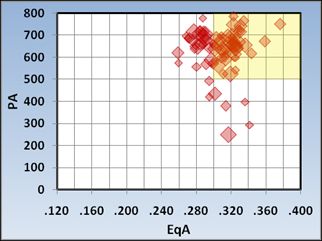 Cabrera has a much tighter spread in his projected performances; there is a huge cluster of comparables with an EqA between .280 and about .330, and somewhere between 600 and 700 plate appearances. Let's explore a few other BSP charts, starting with Juan Pierre, who has a pretty interesting one: Figure 3. Juan Pierre
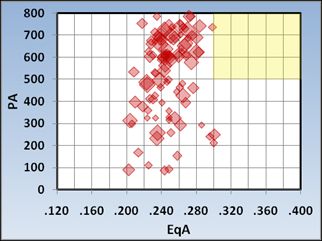 Note that almost all of the variation in Pierre's chart is vertical, along the playing time axis. Players like Pierre are fairly easy to predict in terms of their rate performance: over the last three years, Pierre's batting averages have varied between .276 and .293, his on-base percentages between .326 and .331, and his slugging percentages between .353 and .388; those are not very wide spreads. On the other hand, what teams choose to do with a performance like that is another question. For some teams-like the Dodgers, apparently-that kind of performance is good enough to make a player your everyday leadoff hitter and give him in excess of 700 plate appearances. Other teams will use the player in a platoon arrangement, perhaps netting him around 500 PAs. Still others will regard him as no better than a fourth outfielder. Thus, players like Pierre, whose performances straddle the line between being a marginal regular and an above-average backup, tend to have fairly wide spreads in their playing time projections. In other cases, the correlation between playing time and rate performance is a little more manifest: Figure 4. Jason Giambi
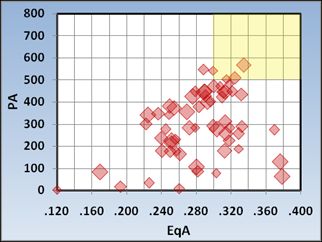 With Jason Giambi, we see that his points tend to stray up along a diagonal, moving from the bottom left-hand corner of the chart to the top right-hand corner. The likelihood is that Giambi will either be fairly decent and work his way into 400-500 plate appearances or that he'll show himself to be washed up and ride a lot of pine. There is very little chance that he can post a .250 EqA and retain a regular turn in the lineup; he will get benched way before then. These diagonal patterns tend to be even more explicit if we look at pitchers. For example, take a look at Daniel Cabrera: Figure 5. Daniel Cabrera
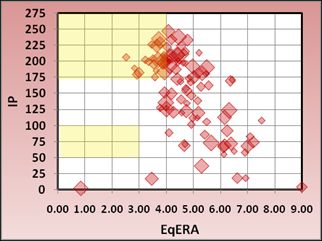 Cabrera is not likely to be afforded the luxury he was last year, in which he managed 34 starts and 204 1/3 innings but posted an ERA of 5.55. He will either have to improve on that performance-and given his considerable talent, he very well could-or he will be demoted to the bullpen or optioned out. Contrast that with someone like Ben Sheets: Figure 6. Ben Sheets
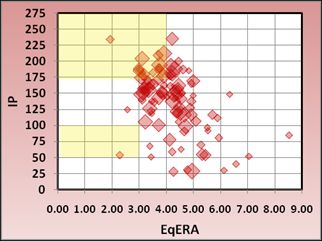 Here, there is not much of a diagonal pattern; the Brewers have a pretty good idea of what Sheets' performance level is likely to be, it's just a question of how long he actually stays healthy to turn in that performance, reflected in a lot of variance along the playing time axis. The opposite of Sheets is probably someone like Dontrelle Willis: Figure 7. Dontrelle Willis
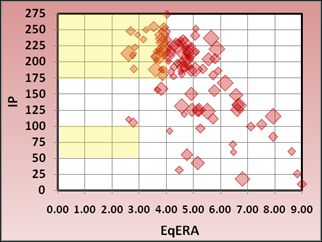 Most of the movement here is along the horizontal axis. Willis is a relatively safe bet to stay healthy, but he could very plausibly post an ERA anywhere from the mid-threes to something in the mid- to high fives. Likewise, with Daisuke Matsuzaka: Figure 8. Daisuke Matsuzaka
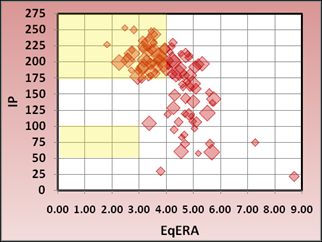 Dice-K should be a fixture in the Red Sox' rotation, but whether he takes two steps forward or one step back is anyone's guess. Still other pitchers have weird, somewhat bimodal performance patterns. Consider Oliver Perez: Figure 9. Oliver Perez
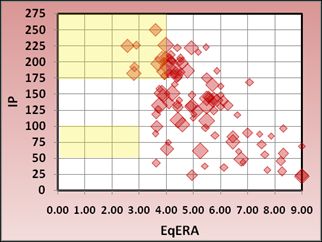 Perez has a couple of different clusters, one in which he stays healthy and throws at least 175 innings with an ERA somewhere just north or south of 4.00 (e.g. the 2007 edition of Oliver Perez), but another where he reverts to an ERA around 5.00 and more limited playing time (the 2005 version). Players like Perez may actually be more valuable than slow-and-steady performers like Mark Buehrle because they have more option value; the stock has more upside if it gets hot, but you can also dump it if it gets cold. These sorts of concepts tend to be even more important as you project outward into future seasons. For example, I sometimes get questions about why older players' rate performances do not tend to decline as much as you might think in their long-term PECOTA forecasts. Manny Ramirez, for example, is projected at a .302 EqA this year and a .289 EqA in 2012, in his age-40 season. That does reflect a little bit of deterioration, but not as much as you might expect given typical aging patterns. The reason for this is that players like Ramirez, who have no tangible defensive value, tend to be out of work pretty quickly if their bats decline. So if Ramirez is still playing in 2012, that likely means that his bat has held up relatively well. On the other hand, PECOTA thinks that there is a greater than 50 percent chance that he will have retired by then. These sorts of patterns are relatively easy to account for if we use a replacement-value metric like VORP or WARP; we simply assign any players that drop out of Ramirez' data set a score of zero. But, they can lead to some ambiguities when measuring performance on a rate basis. We will explore more of these sorts of questions once we get started with the PECOTA Takes on Prospects series next week.
Nate Silver is an author of Baseball Prospectus.
|