 0 comments have been left for this article.
 BP Comment Quick Links

|

|
October 4, 2007 Schrodinger's BatA Rocky Mountain Retrospective
"My words aren't going to do justice to the players' actions, this team's actions, this year. They've given so much of themselves. They've bonded so well. They've competed so fiercely." --- It may officially be "Rocktober" up and down the Front Range, but today we'll adjust our rear view mirrors and take a look back on the Colorado Rockies' regular season. A Play in Five Acts Let's begin with the big picture. The following graph shows three things: the Rockies performance in runs per game, opponent's runs per game, and games above or below .500 from their first game (April 2nd against Arizona) all the way through the thrilling 163rd game against San Diego.
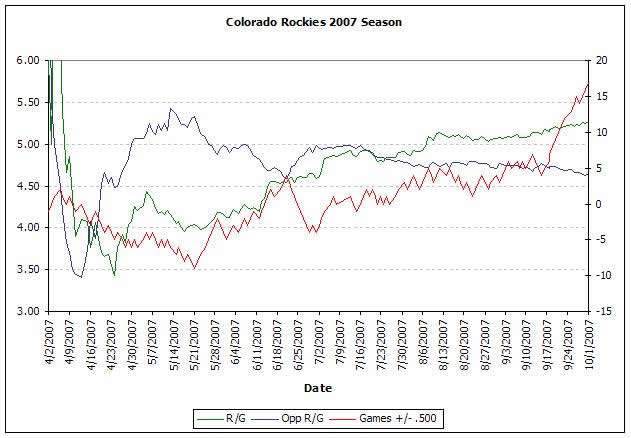
It should be noted that since the graph plots the average runs per game up from the beginning to each point in the season, as the season progresses moving the runs per game lines becomes more difficult. While I'm not usually a big fan of arbitrary "turning points," the twists and turns of the red line above provides us the opportunity to break the Rockies season into five phases.
The Big Picture In the end the Rockies' 2007 season will likely be remembered for one streak, or perhaps even one play at the plate. But as with most of life--and as shown here--the reality is often more complex. Let's take a step back from that chronology to look at a few of the major themes of the 2007 Rockies, and cap it off with a brief look at the future. To do so I thought it might be instructive to go back to the Rockies team essay in Baseball Prospectus 2007 and follow up on a few of the observations that were made prior to the season. To start off with, I looked at the Coors Field park effects, as the humidor was the focus of conversation early in the 2006 season. After noting that the park played essentially neutral during the first two-thirds of 2006 and as an extreme hitter's park in the final third (averaging 14.25 runs per game), we noted: Park factors are notoriously prone to single-year fluctuation [but] it's entirely possible that it will settle down somewhere in between. In fact, that is precisely what happened; home runs and runs per out ticked up a bit from 2006 but to nowhere near their pre-2002 levels, as shown in the following graph:
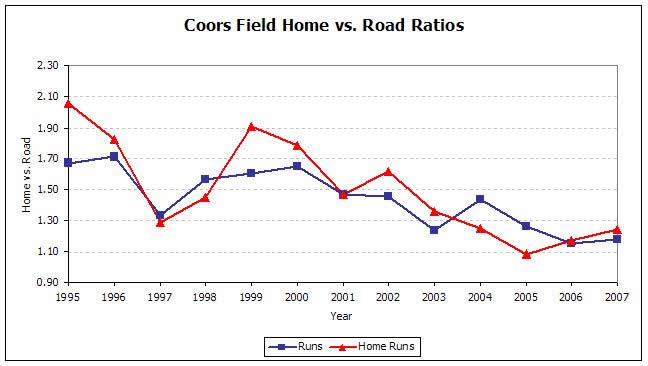
Clearly, Coors Field still plays as a hitter's park, and will continue to do so. However, the apparent stabilization in the effect as shown in the graph due to the humidor is good news for Rockies fans as it makes the front office job of assessing the talent a bit easier. It's also interesting to note that my essay mentioned that "no team from an extreme hitter's park has ever gone to the postseason while finishing in the lower half of their league in park-adjusted ERA." That remains true, since the Rockies' team ERA of 4.32 placed them eighth in the NL, and therefore in the top half of the league when park-adjusted. I then spent some time taking O'Dowd to task for leaving his 2006 squad so obviously vulnerable up the middle offensively, as I went on to note that the probable emergence of Tulowitzki and Chris Iannetta, the signing of Matsui, and the trade of Jason Jennings netting Taveras would help the situation: All of these moves bode well for the Rockies' chances in 2007, as simply league-average offensive performances up the middle could allow the Rox to improve by a half-dozen games. That assessment also panned out--the Rox improved from dead last in the National League in VORP up the middle (catcher, short, second, and center field) at -13.1 runs to 72.5, ranking them eighth against an average of 83.3, as shown in the following table:
VORP Up the Middle 2007
Team       VORP
PHI        215.4
FLO        146.0
ATL        137.4
NYN        136.4
CIN        105.8
LAN         94.2
PIT         88.8
COL         72.5
MIL         66.1
ARI         65.6
SDN         62.3
WAS         41.8
CHN         30.4
HOU         29.6
SLN         27.7
SFN         12.2
That improvement could indeed be said to have added more than a half-dozen games to their win total. When coupled with the fact that they placed first in the NL and second in baseball behind the Yankees in VORP at the corners (third, first, left field and right field) at 149.9 runs, it's clear that the 2007 squad featured a balanced offensive attack, as evidenced by their .264 team EqA, up from .259 in 2006. The only fly in the ointment was that Iannetta struggled early and saw less and less playing time. Yorvit Torrealba was the beneficiary and "took advantage" by posting a .255/.323/.376, .235 EqA line for the season. Iannetta was finally sent down to Colorado Springs on August 7th, and after being recalled on August 26th he hit .320/.393/.520 in limited action down the stretch. As a result, there's no reason to think that he won't again come into spring training as the likely winner of the starting job. In addition, I noted that the addition of Taveras "may make Clint Hurdle feel less obligated to bunt, bunt, and bunt again." In fact, although Hurdle's team once again led the league in sacrifice hits, the total went down from 119 to 83. As always happens when discussing the Rockies, some ink had to be spilled on the lot of their pitching staff, particularly the bullpen. In the essay, I was doubtful about their chances to improve on their WXRL of 2.36, given their reliance on veterans like LaTroy Hawkins while seemingly not being prepared to trust Corpas. Things turned out more than a little better than expected, as Corpas grabbed first a primary set-up job and then the closer role, essentially swapping places with Fuentes. Hawkins (21 Pitching Runs Above Replacement) and Jeremy Affeldt (a PRAR of 20) turned in solid seasons in the seventh inning, with a big assist from Herges (PRAR of 20) and a little help from Ryan Speier (PRAR of 8). Even castoff Jorge Julio, despite late-season struggles leading to his being left off the NLDS roster, contributed over 50 league-average innings. Still, their bullpen put up a WXRL of 7.52 as they improved from 23rd to 21st in baseball. Although not anticipated in the essay, certainly one of the themes of the 2007 season was the improved defense. Indeed, the team committed only 68 errors (the next closest was Baltimore with 79) and sported a defensive efficiency ratio of .703, good for eighth in all of baseball, and up from 22nd (.690) in 2006. Much of that improvement can be attributed to Tulowitzki (45 Fielding Runs Above Replacement), Helton (a 25 FRAR), and, amazingly, Holliday (also 25 FRAR). The latter is especially surprising in light of his player comment, where we said "he's still learning that the shortest route between two points is a straight line." But having watched him live in over 30 games this season, I can attest that, despite the miscue on Monday night, the numbers are no mirage; his routes are much cleaner and his jumps much more quick than in previous seasons. Alas, the focus of many in the mainstream media is on the Rockies setting a new major league record for fielding percentage, which they did, recording a .98925 mark to best the 2006 Red Sox, who'd finished up at .98910. To put a little context on that achievement, the following graph shows the overall fielding percentage in the major leagues since 1871 and through 2007:
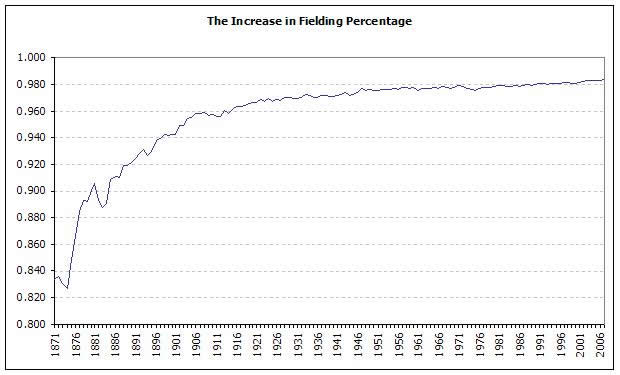
As you can probably tell from the graph, 2007 set a new mark for fielding percentage at .983555, eclipsing the old mark of .98325 set all the way back in 2005. To get a feel for how often the team fielding percentage crown turns over take a glance at the following table:
Team Fielding Percentage Record Holders
Year    Lg     Team      Pct
1871    NA      WS3      .85027
1872    NA      BS1      .87556
1875    NA      HR1      .88108
1876    NL      SL3      .90198
1877    NL      LS1      .90354
1878    NL      BSN      .91425
1881    NL      TRN      .91671
1884    NL      BSN      .92165
1885    NL      NY1      .92944
1889    NL      CL4      .93604
1890    NL      BRO      .94030
1893    NL      PHI      .94378
1894    NL      BLN      .94440
1895    NL      BLN      .94569
1896    NL      CIN      .95119
1898    NL      CL4      .95211
1900    NL      BSN      .95300
1901    NL      PHI      .95444
1902    NL      BSN      .95881
1903    AL      PHA      .96017
1904    AL      CHA      .96365
1905    AL      CHA      .96761
1906    NL      CHN      .96915
1912    NL      PIT      .97250
1919    AL      BOS      .97471
1921    AL      BOS      .97472
1922    AL      CHA      .97579
1923    AL      NYA      .97668
1932    AL      PHA      .97955
1940    NL      CIN      .98099
1944    NL      SLN      .98154
1947    AL      CLE      .98291
1949    AL      CLE      .98303
1958    NL      CIN      .98306
1963    AL      BAL      .98390
1964    AL      BAL      .98465
1980    AL      BAL      .98490
1988    AL      MIN      .98571
1989    AL      BAL      .98603
1990    AL      TOR      .98606
1994    AL      BAL      .98635
1995    AL      BAL      .98645
1998    AL      BAL      .98679
1999    NL      NYN      .98875
2003    AL      SEA      .98887
2006    AL      BOS      .98909
2007    NL      COL      .98925
One of the interesting things about this table is that the Orioles held the mark from 1963 through 1987, and again from 1994 through 1998. The Indians had the second-longest run from 1947 through 1957. The main point here is that fielding percentages rose quickly in the early years of the game, and more slowly in the recent past. As discussed previously in this space, the underlying reasons are the standardization of the game (in this case, through better equipment and better maintained playing surfaces) and the increasing excellence of the players themselves in executing their craft. Where To Go From Here? So what's in store for the Rockies going forward? Obviously the Rockies have accomplished what every small- to mid-market team is hoping for: nurturing a nucleus of good young players who mature in concert. With Iannetta and Ian Stewart likely to become significant contributors in the future, there is no reason to think that this current group, augmented with a few capable veterans, can't be a force in the NL West for the next two to four years. Given the outlook of relatively modest payrolls for the future, however, the organization will continue to have to rely on good scouting to execute trades that bring value (witness the Jennings deal), and the farm system will have to churn out productive players in order to replace those who the team can no longer afford.
|