 0 comments have been left for this article.
 BP Comment Quick Links

|

|
August 30, 2007 Schrodinger's BatTilting the Playing Field
"It is the best game because the players look like us. They are not seven feet tall, they don’t weigh 350 pounds, and they don’t bench-press 650. We can relate to them. We can see them—they’re not obscured by some hideous face mask, and they don’t play behind a wall of Plexiglas—we can touch them and we can feel them. I see Greg Maddux with his shirt off, with his concave chest and no discernible muscles, and I marvel: This is one of the six greatest pitchers in the history of the game? I see Tony Gwynn with his shirt off and I see a short, fat guy with the smallest hands I've ever seen on an athlete, and I wonder: 'This is the best hitter since Ted Williams?'...They are regular guys, at least most of them, who just happen to be really, really good at something that everyone else is not." This fan certainly agrees with Mr. Kurkjian that baseball is indeed the best game. Where opinions start to diverge is in the related claim that because players "look like folks," there is little difference between the players of, say, 60 years ago and today. If we could bring players from the past back to life and suit them up, so the argument goes, Ted Williams would still be walking down the street hearing people call him the greatest hitter who ever lived and Babe Ruth would still be, well, Ruthian. The perception that this view is on the money is fueled not only by the accessibility and appearance of many players, but by the statistics that we use to record their performances on the field. Unlike in swimming or sprinting, accomplishments in baseball are recorded in a relativistic manner, with the credits of hitters perfectly balancing with the debits of pitchers and defenders, as in an accountant's ledger book. In addition, the powers that be have ensured that the balance between offense and defense has never swayed too far from a historical norm; with some exceptions, individual performance data can be reasonably compared across eras by the average fan. As a result, similar stat lines from different eras can mask underlying differences in the skills and abilities of players that would be otherwise evident if they played side by side. As I discussed in a column last January titled "The Myth of the Golden Age", the same processes that drive improvements in other systems and sports are at work in baseball. Chief among these are that complex systems improve when the best performers play by the same rules for an extended period of time, permitting the system to reach equilibrium and allow various strategies and techniques to be discovered, selected, and optimized. In baseball, this manifests itself in everything from defensive positioning and technique to batting stances and pitching mechanics that have improved over time through a process of trial and error. Secondly, as in all sports, today's athletes are superior to those of the past in size, speed, and strength, as evidenced by contests where an absolute--rather than a relative--measuring stick is used (as in track and field). When combined with the advantages of modern medical care, nutrition, and training regimes, this improvement has pushed the average major leaguer closer to the absolute right wall of human ability. These processes have had the consequence of decreasing the variation between players. In short, the greats of the past were outliers who could take advantage of the sub-optimal play among populations characterized by a lower general level of ability. But in addition, baseball has also benefited from an ever-increasing population pool from which to draw--first via African-American integration, and later through the influx of Latin and, more recently, Asian players. More players to choose from will ensure that the quality of those players is higher. And this was on the heels of a minor league and scouting system that has been developing since Branch Rickey increased the efficiency of discovering and cultivating talent. All of this adds up to an increasing excellence in play on the field. In the previous article we discussed several attempts to detect the magnitude of that increase using various lines of evidence; before closing my off-season ruminations in late February, I promised readers that we'd have one more installment related to this topic. And so for those who have been on pins and needles since before the snow melted and the games began, this is your lucky day. Today we'll take one of those techniques and apply it to position players in order to tilt the stat lines away from the forces that have conspired to level the playing field. A Lack of Selection Pressure As discussed in the previous column, we'll use the offensive production of pitchers relative to position players as a measure of the increasing level of play over time. As the game evolved from where pitching was throwing underhand with a straight arm (as in "pitching" horseshoes) in the 1850s, to a variety of submarine and sidearm deliveries in the 1860s and 70s, and finally to the full overhand delivery after 1883 in the National League (NL) and 1884 in the American Association (AA), pitchers were selected primarily for their pitching and not their hitting ability. In an evolutionary sense, batting skills of pitchers did not undergo the same selection pressure as their pitching skills. The consequence of substantially lowering or removing this selection pressure is that the actual or true hitting ability of pitchers should have remained relatively constant throughout the history of baseball. By comparing the offensive production of pitchers to position players who do face the rigors of selection, we should be able to measure the increase in the level of play. This is the case since the factors mentioned previously are all constantly contributing to subtly raising the talent level of the environment in which pitchers as batters find themselves less and less able to successfully compete. Ironically, their frustration as a group is in large part a consequence of their own ever-increasing ability to execute their craft. As I showed in the previous column, the results from making this comparison do indeed show a decrease in offensive output for pitchers over time. Unlike in the previous column, however, the following graph breaks down park-adjusted normalized OPS for pitchers relative to hitters by league.
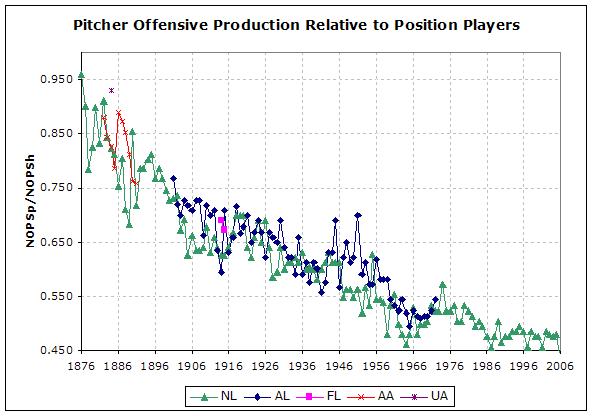 Pitchers as a group were pretty similar to position players in terms of offensive output in the 1870s, often producing in the range of 80 to 95 percent. That started to change relatively quickly in the 1880s; by 1901 pitchers would see their last season at 75 percent or above as recorded in the nascent American League (AL). The ratio fell from around 70 percent in the first decade of the twentieth century to under 50 percent most recently, as illustrated in the following table (AL and NL only), with only a small bump in the 1970s:
Pitcher Production Relative to Hitters
Decade     Ratio
----------------
1900s      .694
1910s      .662
1920s      .653
1930s      .612
1940s      .606
1950s      .574
1960s      .510
1970s      .526
1980s      .494
1990s      .478
2000s      .465
The trend by decade shows a fairly steep decrease from the 1900s through the 1920s, a leveling off in the 1930s and 40s, and then another steep decline in the 1950s and 1960s before the increase in the 1970s followed by smaller declines in the 1980s, 90s, and first decade of this century. In one sense this is what we might expect. For example, we could easily imagine that this tracks with the following five-era chronology:
The other interesting aspect of this graph that may be unexpected is that it shows pretty clearly the differences in the leagues themselves. For example:
Where things appear less clear, the data indicates that from 1914 through 1926 the leagues appeared fairly evenly matched, but then the tide turned back to the NL again through the early 1930s. Beginning around 1934 the balance again returned and stayed through the end of World War II. Upside Down and Backwards So if we're correct in our assumption that pitcher hitting records the rate at which the level of play has increased, we can use that data to construct an index of level of play over time. However, since the data from the plot above has a lot of noise in it and slopes in the wrong direction, we'll apply a couple of transformations. By combining both the NL and AL, applying a moving average, inverting the ratios from the above plot, and finally normalizing each year relative to 2006, we can smooth out the rough edges and come up with the following graph, which shows the "Level Index," or LI, for each year beginning in 1876:
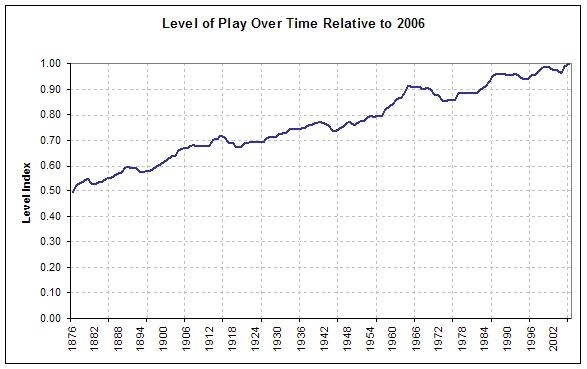 You'll notice that this graph follows the trends noted earlier, in addition to picking up the effects of both World Wars, which interrupted the upward march temporarily. Readers somewhat familiar with this discussion will note that earlier this summer David Gassko wrote a three part series of articles where he used a different technique to develop a similar index, and compare that to the methods used in both Dick Cramer's original 1977 study and by Clay Davenport's Baseball Between The Numbers essay. That methodology relies on direct comparisons of player performance from year to year, and is somewhat more difficult to sort out, given there are conflating factors at work. Gassko's version of that technique--after a critique by our own Nate Silver--accounts for regression to the mean using a player's predicted career performance based on plate appearances, as well as neutralizing the affects of aging by using only 26 to 29 year olds (who show no overall performance change during that time span). In his addendum on the subject, Gassko produces a graph that depicts his final attempt along with Davenport's method, and which looks similar to the graph above. A quick side-by-side comparison reveals that the LI line we've drawn here has a slightly larger slope, thereby somewhat splitting the difference between Davenport and Gassko, although ending up much closer to Gassko. If you click on the link and review his graph, you'll also notice that the dip during World War II in all the lines shown by Gassko is more pronounced than shown here. The reason is that we've used a moving average, which tends to smooth out the data. While that's good for most of the graph, it underestimates the magnitude of the talent loss during the war. There is now one final adjustment to make. If we're going to tilt the playing field, we'll also need to adjust for the differences between leagues. As mentioned previously, the chart of pitcher versus position player hitting provides us with some data to use to create separate LIs for the AL and NL. The way this was done was to note that relative percentage difference between the leagues, again using a moving average, and then to calculate how that difference would be reflected if it were applied to the previous graph. The result is the graph below, where the AL is depicted in red and the NL in blue:
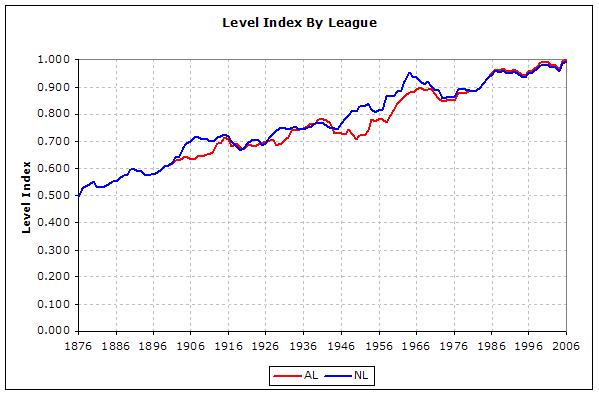 Based as it is on the relative performance of pitcher hitting, it includes the same differences noted earlier, namely the strength of the NL in the 1900s, and again in the post-integration era. The weakness of his approach is that since pitcher hitting data dries up after 1972, we need to estimate the league differences after that time. I've done this by showing a slight advantage for the NL through the 1970s, introducing parity in the mid-80s, and then giving the AL a slight advantage through the present. Surely this isn't a perfect system; in simply eyeballing the results, it probably overestimates the difference between the leagues in the late 40s and early 50s. Tilt! Finally, we're able to use the previous graph to tilt the playing field. To take this final step we'll use Keith Woolner's Win Expectancy (WX) framework and the derivative WX1 that I discussed in a column last year. In short, the WX framework allows for the aggregation of all events that a batter was responsible for, and debits or credits the player corresponding to how much that event pushed his team either towards winning or losing. It does not include defense or baserunning. The derivative WX1 relies on the same concept, although instead of being calculated using individual plays complete with their base, out, inning, and run environment attributes, it uses general coefficients for each offensive event based on the run environment of the league and the player's home park. This provides an overall picture of the win contribution of a player. Basically, WX1 is a shorthand way of getting to WX when you don't have play by play records available, as we don't prior to 1959. When we calculate WX1 for all AL and NL seasons going back to 1876, we find that the top and bottom 15 seasons are as follows:
Year    Name                  PA     WX1
----------------------------------------
2001    Barry Bonds          655    11.3
2002    Barry Bonds          603    10.6
1923    Babe Ruth            695     9.7
1921    Babe Ruth            689     9.5
1920    Babe Ruth            612     9.4
1927    Babe Ruth            691     9.2
1926    Babe Ruth            649     9.1
1927    Lou Gehrig           714     9.0
1946    Ted Williams         670     8.9
1941    Ted Williams         603     8.9
1957    Mickey Mantle        623     8.7
1917    Ty Cobb              665     8.6
2004    Barry Bonds          608     8.5
1924    Rogers Hornsby       638     8.4
1942    Ted Williams         667     8.4
----------------------------------------
1891    Lou Bierbauer        528    -4.7
1890    Germany Smith        523    -4.8
1884    Jim Lillie           476    -4.8
1891    Germany Smith        550    -4.8
1892    Joe Quinn            567    -4.8
2002    Neifi Perez          585    -5.0
1885    Joe Gerhardt         423    -5.1
1894    Chippy McGarr        551    -5.2
1895    Jack Boyle           620    -5.2
1890    Bob Gilks            576    -5.2
1894    John Ward            574    -5.3
1893    Joe Quinn            580    -5.5
1886    Jim Lillie           427    -5.5
1933    Jim Levey            564    -5.9
1894    Jiggs Parrott        533    -6.1
Bonds, Ruth, and Williams dominate the list, taking eleven of the top fifteen spots, with Gehrig, Mantle, Cobb, and Hornsby each grabbing a spot. Bonds is the only player to amass 10 wins, doing so in both 2001 and 2002. On the other end of the spectrum, the only players not from the nineteenth century include Neifi the Terrible and Jim Levey; the latter played shortstop for the 1933 St. Louis Browns in what would be, at age 26, his final year in the big leagues. That season he hit .195/.237/.240 in those 564 plate appearances and was 20 runs below average on defense for good measure. Because the bottom of the list is dominated by nineteenth century players, we'll re-run the bottom fifteen starting at 1901, thereby allowing Neifi to sneak in there one more time, along with the immortal Rob Picciolo of the 1977 A's.
Year    Name                  PA     WX1
----------------------------------------
1902    John Gochnauer     506.0    -4.1
1977    Rob Picciolo       445.0    -4.1
1901    John Ganzel        553.0    -4.1
1936    Skeeter Newsome    507.0    -4.3
1937    Jackie Hayes       629.0    -4.3
1901    Bill Hallman       521.0    -4.4
1999    Neifi Perez        731.0    -4.5
1909    Bill Bergen        372.0    -4.5
1931    Jim Levey          538.0    -4.5
1934    Ski Melillo        588.0    -4.5
1932    Ski Melillo        657.0    -4.5
1953    Billy Hunter       602.0    -4.6
1933    Art Scharein       521.0    -4.6
2002    Neifi Perez        585.0    -5.0
1933    Jim Levey          564.0    -5.9
Now, applying our Level Index, we'll run the top and bottom 15 seasons again, this time accounting for the difficulty of the league. Keep in mind that this adjustment treats every player as if they were transported to the 2006 AL with their hitting skills from the season in question intact.
Year    Name                 PA     WX1
---------------------------------------
2001    Barry Bonds         655    11.0
2002    Barry Bonds         603    10.3
2004    Barry Bonds         608     8.2
1998    Mark McGwire        675     8.0
2001    Sammy Sosa          705     7.6
1993    Barry Bonds         672     7.1
2003    Albert Pujols       675     7.0
1992    Barry Bonds         607     7.0
1941    Ted Williams        603     6.9
2003    Barry Bonds         540     6.8
1957    Mickey Mantle       623     6.8
1923    Babe Ruth           695     6.6
2001    Jason Giambi        658     6.6
1961    Mickey Mantle       646     6.6
1942    Ted Williams        667     6.5
---------------------------------------
1897    Germany Smith       449    -8.0
1894    Germany Smith       523    -8.0
1886    Joe Gerhardt        448    -8.1
1891    Germany Smith       550    -8.1
1892    Joe Quinn           567    -8.2
1879    Will White          300    -8.6
1890    Bob Gilks           576    -8.8
1884    Jim Lillie          476    -8.9
1895    Jack Boyle          620    -8.9
1894    Chippy McGarr       551    -9.0
1894    John Ward           574    -9.1
1885    Joe Gerhardt        423    -9.2
1893    Joe Quinn           580    -9.3
1886    Jim Lillie          427   -10.1
1894    Jiggs Parrott       533   -10.6
Not surprisingly, Bonds still dominates, this time adding his 2004, 1993, 1992, and 2003 campaigns to the list in capturing six of the top fifteen slots. Ruth is left with just his 1923 season (although he does claim two more spots in the top 20) making it the least recent, while Williams hangs on to two spots and Mantle actually adds his 1961 effort in the fifteenth slot. New to the list are recent stars McGwire, Sosa, Pujols, and Giambi. Derrek Lee's 2005 season also ranks 25th. To give you a feel for the magnitude of the adjustment, you'll notice that Ruth, Giambi, and Mantle are all tied at 6.6 wins and each separated by about 40 years. Their unadjusted batting lines for those three seasons are:
Year  Name    PA    AVG/OBP/SLG    HR  BRAA   EqA
-------------------------------------------------
1923  Ruth   695  .393/.545/.764   41   120  .405
1961  Mantle 646  .317/.448/.687   54    96  .379
2001  Giambi 658  .342/.477/.660   38    85  .369
Obviously the worst players from the remotest time period will do the most poorly, and now the entire list contains nineteenth century players. Poor Jiggs Parrott put up a .248/.274/.333 line playing for the Chicago Colts in the highest-scoring league (7.36 runs per game per team) in our data set. Next, we'll look at WX1 from the perspective of entire careers, with the unadjusted leaders and trailers in the following tables:
Name                  Start    End      PA     WX1
--------------------------------------------------
Babe Ruth              1914   1935   10573   116.2
Barry Bonds            1986   2006   12026   108.6
Ty Cobb                1905   1928   12978   102.1
Ted Williams           1939   1960    9752    97.3
Hank Aaron             1954   1976   13908    89.3
Stan Musial            1941   1963   12659    86.0
Willie Mays            1951   1973   12449    83.8
Mickey Mantle          1951   1968    9896    81.8
Lou Gehrig             1923   1939    9615    78.1
Rogers Hornsby         1915   1937    9427    76.8
Tris Speaker           1907   1928   11885    73.9
Mel Ott                1926   1947   11273    70.2
Frank Robinson         1956   1976   11545    67.1
Eddie Collins          1906   1930   11960    62.4
Honus Wagner           1897   1917   11614    61.3
--------------------------------------------------
Davy Force             1876   1886    3081   -30.0
Fred Pfeffer           1882   1897    6544   -30.2
Herman Long            1890   1904    7798   -30.3
Ed Brinkman            1961   1975    6600   -30.8
Bones Ely              1884   1902    4991   -31.0
Ozzie Guillen          1985   2000    7126   -32.0
Malachi Kittridge      1890   1906    4438   -32.4
Bill Bergen            1901   1911    3228   -33.3
Kid Gleason            1888   1912    8160   -33.9
John Ward              1878   1894    7455   -34.6
Germany Smith          1884   1898    4638   -34.8
Alfredo Griffin        1976   1993    7305   -35.1
Bobby Lowe             1890   1907    7670   -35.9
Joe Quinn              1885   1901    6304   -39.5
Tommy Corcoran         1892   1907    8252   -41.8
Next, we'll make the adjustment by evaluating each season of their careers in the context of the 2006 AL:
Name                  Start    End      PA     WX1
--------------------------------------------------
Barry Bonds            1986   2006   12026   104.6
Babe Ruth              1914   1935   10573    80.4
Hank Aaron             1954   1976   13908    78.9
Ted Williams           1939   1960    9752    73.7
Willie Mays            1951   1973   12449    73.4
Stan Musial            1941   1963   12659    69.3
Ty Cobb                1905   1928   12978    68.4
Mickey Mantle          1951   1968    9896    66.2
Frank Robinson         1956   1976   11545    59.2
Lou Gehrig             1923   1939    9615    55.9
Rogers Hornsby         1915   1937    9427    53.6
Rickey Henderson       1979   2003   13248    52.1
Mel Ott                1926   1947   11273    51.9
Frank Thomas           1990   2006    9084    51.8
Jeff Bagwell           1991   2005    9303    50.8
--------------------------------------------------
Jack Burdock           1876   1891    3747   -48.1
Tom Burns              1880   1892    5190   -48.7
Pud Galvin             1879   1892    2402   -48.7
Bill Bergen            1901   1911    3228   -48.7
Herman Long            1890   1904    7798   -50.5
Bones Ely              1884   1902    4991   -52.0
Malachi Kittridge      1890   1906    4438   -53.9
Fred Pfeffer           1882   1897    6544   -53.9
Kid Gleason            1888   1912    8160   -55.4
Davy Force             1876   1886    3081   -56.3
Bobby Lowe             1890   1907    7670   -59.4
Germany Smith          1884   1898    4638   -59.7
John Ward              1878   1894    7455   -62.8
Tommy Corcoran         1892   1907    8252   -67.9
Joe Quinn              1885   1901    6304   -68.0
Bonds takes over the top spot by a large margin, while Cobb falls from second to seventh. Ruth remains somewhat Ruthian, but is now coupled with Aaron. In the first list, the third through sixth spots were occupied by Williams, Aaron, Musial and Mays, while in the adjusted list the order is now Aaron, Williams, Mays, and Musial. Meanwhile, Gehrig only falls one spot, while Tris Speaker (now 16th), Eddie Collins (23rd), and Honus Wagner (24th) drop out of the top 15 altogether, with Rickey Henderson, Frank Thomas, and Jeff Bagwell taking their places. In addition, active players Gary Sheffield (18th), Manny Ramirez (27th), Chipper Jones (28th), and Mike Piazza (30th) all move up considerably. Once again, to get a feel for the adjustment, take a look at the career lines of Cobb and Musial, whose adjusted wins are very close at 68.4 and 69.3 respectively:
Name      PA    AVG/OBP/SLG     HR   BRAA   EqA
-----------------------------------------------
Cobb   12978  .366/.433/.512   117   1206  .335
Musial 12659  .331/.417/.559   475   1083  .332
In absolute terms, the adjustments cost Ruth the most (more than 35 wins), while also being hard on Cobb (34), Speaker (25), Williams (24), and Hornsby (23). Finally, let's take a look at the unadjusted leaders in WX1 per 600 plate appearances for those players with 2000 or more plate appearances in their careers:
Name                  Start    End      PA     WX1Rate
--------------------------------------------------
Babe Ruth              1914   1935   10573     6.6
Ted Williams           1939   1960    9752     6.0
Barry Bonds            1986   2006   12026     5.4
Albert Pujols          2001   2006    4014     5.0
Mickey Mantle          1951   1968    9896     5.0
Rogers Hornsby         1915   1937    9427     4.9
Lou Gehrig             1923   1939    9615     4.9
Ty Cobb                1905   1928   12978     4.7
Joe Jackson            1908   1920    5631     4.3
Stan Musial            1941   1963   12659     4.1
Willie Mays            1951   1973   12449     4.0
Hank Aaron             1954   1976   13908     3.9
Johnny Mize            1936   1953    7319     3.8
Mel Ott                1926   1947   11273     3.7
Tris Speaker           1907   1928   11885     3.7
Dick Allen             1963   1977    7298     3.7
Mark McGwire           1986   2001    7585     3.7
Joe DiMaggio           1936   1951    7625     3.6
Jimmie Foxx            1925   1945    9657     3.6
Frank Thomas           1990   2006    9084     3.5
Ruth and Williams are well ahead of the pack, although Pujols ties with Mantle for fourth place, while Frank Thomas slides in at number 20. This list also contains our first glimpses of Joe DiMaggio, Dick Allen, Jimmy Foxx, Johnny Mize, and Joe Jackson.
Name                  Start    End      PA     WX1Rate
--------------------------------------------------
Barry Bonds            1986   2006   12026     5.2
Albert Pujols          2001   2006    4014     4.9
Babe Ruth              1914   1935   10573     4.6
Ted Williams           1939   1960    9752     4.5
Mickey Mantle          1951   1968    9896     4.0
Willie Mays            1951   1973   12449     3.5
Mark McGwire           1986   2001    7585     3.5
Lou Gehrig             1923   1939    9615     3.5
Frank Thomas           1990   2006    9084     3.4
Rogers Hornsby         1915   1937    9427     3.4
Hank Aaron             1954   1976   13908     3.4
Dick Allen             1963   1977    7298     3.3
Lance Berkman          1999   2006    4414     3.3
Stan Musial            1941   1963   12659     3.3
Jeff Bagwell           1991   2005    9303     3.3
Travis Hafner          2002   2006    2065     3.2
Ty Cobb                1905   1928   12978     3.2
Chipper Jones          1993   2006    7528     3.1
Mike Piazza            1992   2006    7386     3.1
Frank Robinson         1956   1976   11545     3.1
As you would expect, several actives players jump into the list; perhaps most surprisingly, Lance Berkman coming in at 13th, and Travis Hafner at 16th. Wrapping Up So in the end, what does all of this tell us? I think it's important to note that while adjusting these statistics using the LI method certainly makes a difference, it does not wipe out the greatness of past stars by equating them to reserve players in today's game. Yes, they're knocked down a few pegs, but the adjusted lists are not populated only by active and recently-retired players. For example, Honus Wagner's fabulous 1908 Deadball Era season--in which he hit .354/.415/.542 with a .362 EqA--is adjusted to 5.5 wins, dropping it from the 28th--greatest offensive season of all time to the 62nd; it's still in the company of Sammy Sosa's 2000 campaign in which he hit .320 with 50 home runs, Ruth's 1928 season, and Frank Thomas's 1991 efforts. Wagner would still be a star, simply one that couldn't dominate so completely. Secondly, it should remind us that we have the privilege of watching players like Albert Pujols, who are among the most skilled hitters who have ever put on a uniform. But finally, while analyses like these are interesting, ultimately they're not a complete answer to the question, since they have nothing to say regarding some of the more interesting speculations. For example, how would Ruth have done with the aid of modern medicine, training programs, and especially nutrition? How would Pujols or Bonds perform without those aids and with inferior equipment, facilities, and the rigors of train travel? These are questions for which there can never be a complete answer; perhaps that's just fine, since it continues to leave us room for arguing about who was the greatest.
|